May 2020 Real Estate Sold Statistics Hamilton
We are now into our third month since COVID-19 was officially declared a Pandemic on March 11th, 2020, and are seeing the effect on the Real Estate Market. Statistically, March, April, May and June are the busiest months for both sellers putting their homes on the market and buyers looking to purchase. Typically this is done so families can purchase in the Spring, then have their move-in date in the summer when kids are out of school and the weather is better (no snow to move in!). Deemed an Essential Service on March 23rd, Ontario Real Estate transactions continued to occur, however, at a much slower and cautious pace.
As the Province inches towards the beginning stages of restarting the economy, and more businesses are allowed to open, slowly we are seeing more sellers feeling confident enough to put their properties up for sale. In comparison to the same 10 weeks last year (April and May), there were 1683 New Listings in 2019 that came on the market and only 873 New Listings in 2020. Mid-April to mid-May showed the biggest difference, with only 291 New Listings in Hamilton in 2020, and 835 New Listings in 2019.
More and more policies and safeguards are being implemented, such as virtual showings, better virtual tours and floor layouts, online evaluations, and even home inspections are sometimes being performed virtually. Digital signatures are now the norm for all and are very simple to use. Our main concern is still and always will be, the health and well being of you and your family. Stay at home! Please reach out if you have any questions or if you need any help!
Here is a look at the second full month of statistics since the shutdown. May 2020 had only 1186 Total Residential Listings come through the Hamilton Real Estate Board, which is expectedly down from the 2334 Listings in May 2019, as reported by The REALTORS ® Association of Hamilton-Burlington (RAHB). Hamilton had 762 of those (down from 1530 in 2019) and Burlington’s share was 283 (down from 557 in May 2019).
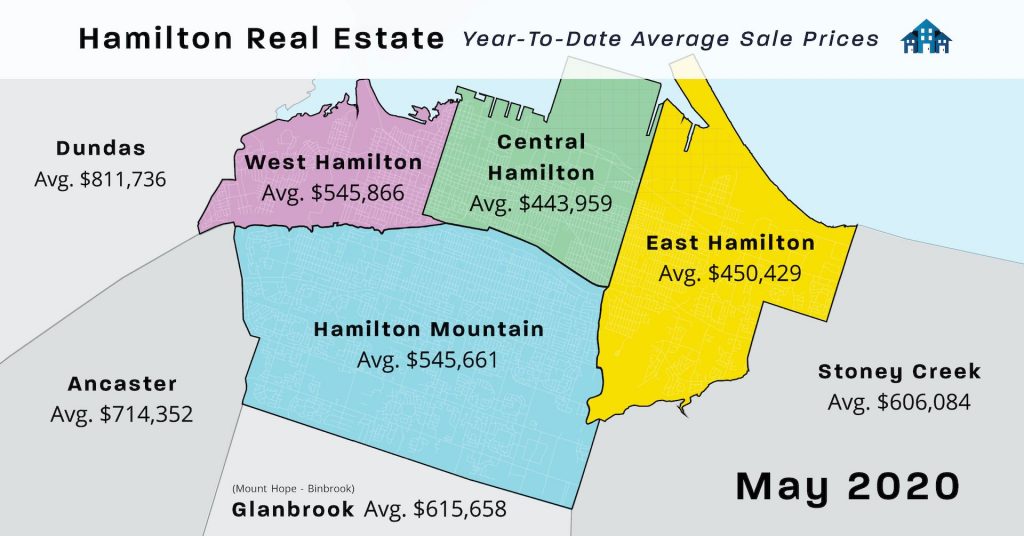
Residential Sales located throughout the RAHB market area (including Burlington and all the outlying areas covered by The REALTORS ® Association of Hamilton-Burlington) of 852 Properties are down 42.2% from May 2019 and up 43.4% from last month, April 2020. The overall average price for residential properties increased by 10% from May 2019 to $655,418 and is also up 6.3% from last month. Hamilton’s Residential Sales (including Flamborough, Dundas, Ancaster, Waterdown, Stoney Creek and Glanbrook) were just 574, down 40% from 958, with an average price of $604,578 up 10% from May 2019. Burlington had 189 Sales which is down 48% from 364, with an average price of $834,808 which is up 12% from May 2019.
The end of month listing inventory which is a good indication of the type of market currently being experienced shows 965 Active Residential Listings giving Hamilton 1.7 months of inventory, down 32% from May 2019. Burlington has 348 Active Residential Listings giving it 1.8 months of inventory, down 30%. The average days on the market up from 25.6 to 28.9 in Hamilton and also went up in Burlington from 24.8 to 28.5. Right now the Hamilton-Burlington Area is sitting in a Sellers Market, where the ratio of Homes Sold to Homes Listed is above 60%, currently sitting at 71.8%. In other words, 7.2 homes are sold for every 10 new listings. Note that this has increased to almost the same amount as it was in February 2020 which was in a strong Sellers Market at 73.7%! It will be interesting to see how June will be with the implementation of the new guidelines coming into effect from CMHC (Canada Mortgage and Housing Corporation). People that need to use CMHC will have to have a Credit Score of 680 or above and the TDS and GDS ratios will now be lower. Check again with your Mortgage Broker to see what this will mean for your qualification! Homes Sold to Homes Listed Ratio: Buyers Market is below 40%, Balanced Market is between 40-60%, and Sellers Market is above 60%. For the rest of the article Click Here