May 2019 Real Estate Sold Statistics Hamilton
Hamilton Ontario Real Estate Market Report for May 2019
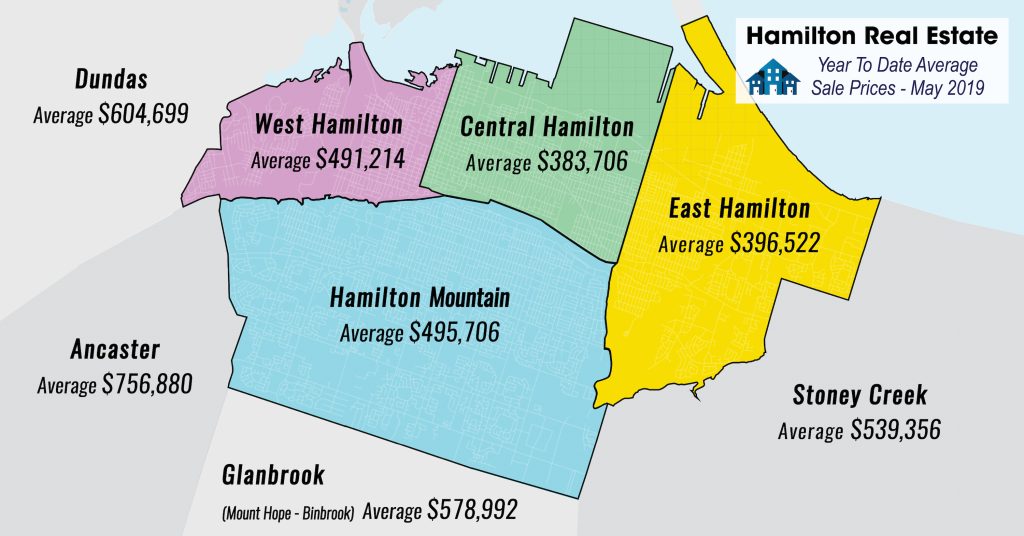
May 2019 had 1430 Residential Listings come through the Hamilton Real Estate Board which was virtually the same as May 2018 (1437) as reported by The REALTORS ® Association of Hamilton-Burlington (RAHB). Burlington is still DOWN from last year, by 13% with only 529 New Listings (610 in May 2018). Residential Sales located throughout the RAHB market area (including Burlington and all outlying areas covered by RAHB) of 1344 Properties were up this month, a 10.9% increase from the same month last year and up 9.6% over April 2019 and 30.2% over March 2019! Residential Sales in Hamilton (which includes Hamilton plus Flamborough, Dundas, Ancaster, Waterdown, Stoney Creek and Glanbrook) were 877 of that total. The Average Hamilton Residential Sales Price of properties sold through the RAHB Multiple Listing Service® (MLS) system in May 2019 was $549,891 up 6% from $519,146 the same month last year. Burlington is down 5%to $733,410. The end of month listing inventory shows 1669 Active Residential Listings, giving Hamilton 1.9 months of inventory, which is down just 4% compared to 1741 Properties still available for sale at the end of May last year which was 2.3 months of inventory. Burlington has 1.7 months of inventory (down 18%) with 566 active listings for sale. Average days on the market increased very slightly from 25.3 to 25.9 this month for Hamilton, however, it decreased very slightly in Burlington from 25.7 to 25.0. The Hamilton – Burlington Area is still sitting at the low end of a Sellers Market right now, where the ratio of Homes Sold to Homes Listed is above 60%, currently sitting at 61.4% for Residential, (in other words, 6.1 homes are sold for every 10 new listings). NOTE: Homes Sold to Homes Listed Ratio: Buyers Market is below 40%, Balanced Market is between 40-60%, and Sellers Market is above 60%. For the rest of the article – Click Here