
January 2026 Hamilton Real Estate Statistics
Residential Real Estate Statistics | Hamilton, Burlington & Area
Year-To-Date Average Price – January 2026
The chart below illustrates the year-to-date average residential sale price across the Hamilton-Burlington region, with side-by-side comparisons to the two previous years. Viewing current pricing trends against recent historical performance helps identify whether values are strengthening, stabilizing, or adjusting as the market moves through 2026.

Source: ITSO / Showing Time – Live MLS Market Activity
Market Overview – January 2026
The Hamilton-Burlington residential real estate market opened 2026 in Buyer’s Market territory, driven primarily by a sharp increase in new listings rather than a meaningful decline in sales activity. While overall sales edged slightly higher compared to December, the surge in listing activity gave buyers more choice and shifted negotiating dynamics early in the year.
Despite year-over-year declines in both sales and prices, month-over-month data suggest a market showing early signs of stabilization as conditions adjust following the end of 2025.
Sales Activity
A total of 469 residential properties sold across the Hamilton-Burlington region in January
- Slightly higher than December’s 463 sales
- Down 17.1% compared to January 2025 (566 sales)
By Area
- Hamilton: 320 Sales (down 15.8% year-over-year)
- Burlington: 95 Sales (down 17.4% year-over-year)
Pricing Trends
The average residential sale price in January was $788,097, up from $749,911 in December but down 5.1% compared to January 2025.
While month-over-month prices improved, the average sale price is best viewed as a long-term trend indicator. Price performance continues to vary significantly by neighbourhood, property type, and price range.
New Listings
There were 1,198 new residential listings added to the market in January.
- Up sharply from 543 listings in December
- Down 17.7% compared to January 2025 (1,456 listings)
By Area
- Hamilton: 772 new listings
- Burlington: 251 new listings
The influx of new listings was the primary driver behind the shift into Buyer’s Market conditions this month.
Inventory and Months of Supply
Active inventory across the region ended January at 2,314 listings, slightly higher than December (2,305) and up 6.7% year-over-year. This translated into 3.2 months of supply, up from 3.1 months in December and up 23.1% compared to January 2025.
Local Supply Conditions
- Hamilton: 3.3 months of supply
- Burlington: 2.6 months of supply
Days On Market
Homes are taking longer to sell compared to late 2025, reflecting increased buyer choice.
- Hamilton: 56 days on average (up from 54 in December, down from 61 last year)
- Burlington: 51 days on average (consistent with both last month and last year)
Market Definitions (Sales-to-New-Listings Ratio)
- Buyers Market: Below 40%
- Balanced Market: 40% – 60%
- Seller’s Market: Above 60%
January 2026 SNLR: 39%, placing the market firmly in Buyer’s Market territory.
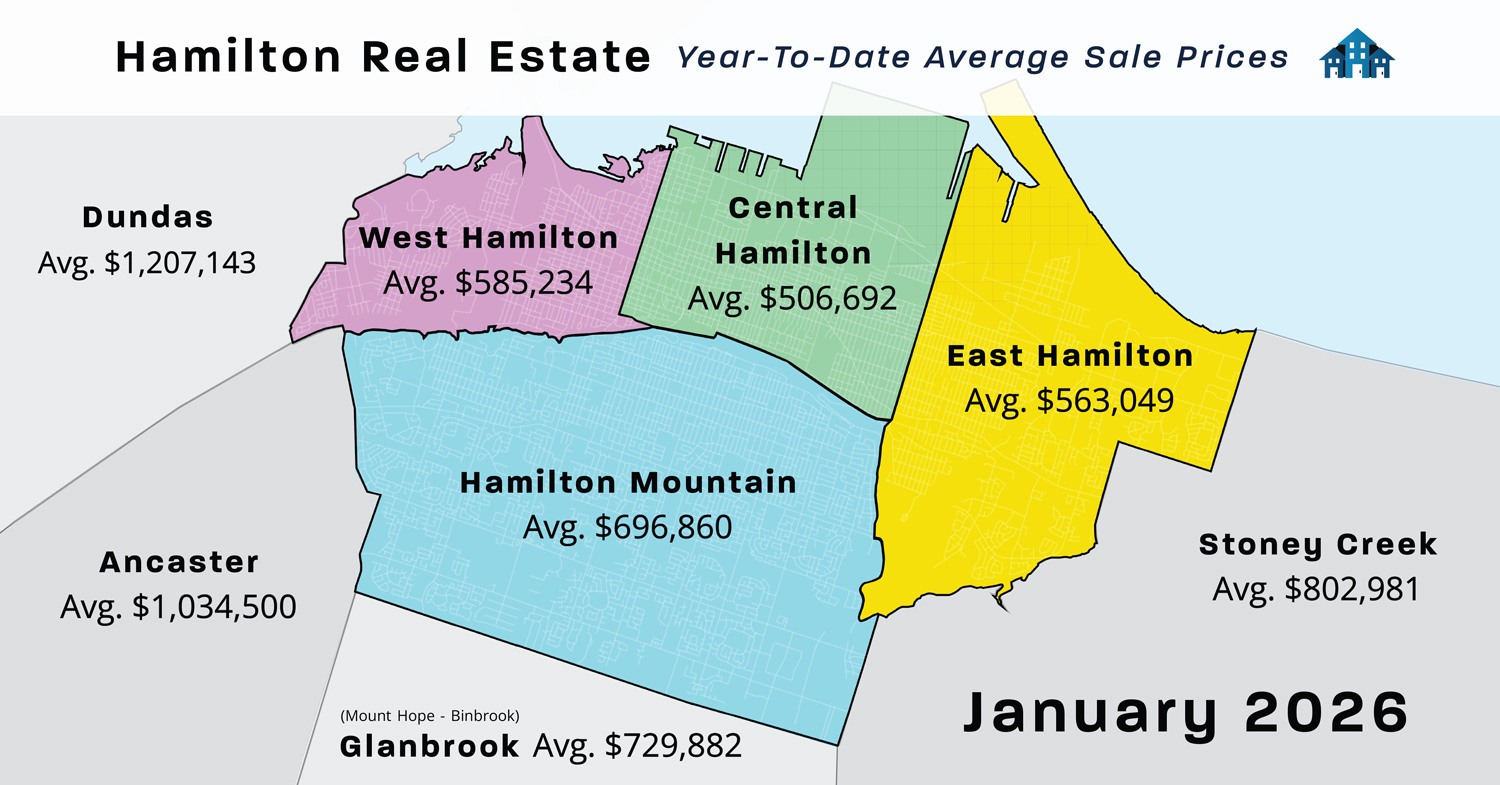
Year-To-Date Average Residential Prices By Area (Jan 2026)
The map below shows year-to-date average residential prices across the Hamilton-Burlington region. As January represents the first month of the year, these figures currently reflect January activity only. While average prices can shift month to month, they remain useful for identifying broader geographic pricing patterns across the region.
Hamilton – $734,639 – Down
Burlington – $1,060,276 – Down
Flamborough – $1,304,375 – Up
Waterdown – $966,111 – Up
Grimsby – $584,868 – Down
Caledonia – $653,667 – Down
Cayuga – $1,054,000 – Up
Dunnville – $496,125 – Down
January 2026 Residential Sales & Average Prices By Area
RAHB Market Activity |
Number of Sales Jan 2026 |
Number of Sales Jan 2025 |
Average Sale Prices in Jan 2026 |
Average Sale Price Jan 2025 |
|
West Hamilton
|
23
|
25
|
$585,234
|
$687,620
|
|
East Hamilton
|
41
|
39 |
$563,049
|
$543,682
|
|
Central Hamilton
|
50
|
46 |
$506,692
|
$539,517
|
|
Hamilton Mountain
|
79
|
91 |
$696,860
|
$724,824
|
|
Flamborough
|
8
|
13 |
$1,304,375
|
$1,084,537
|
|
Dundas
|
7
|
17 |
$1,207,143
|
$893,894
|
|
Ancaster
|
33
|
33
|
$1,034,500
|
$1,042,891
|
|
Waterdown
|
18
|
20
|
$966,111
|
$984,550
|
|
Stoney Creek
|
44
|
69 |
$802,981
|
$818,705
|
|
Glanbrook
|
17
|
27 |
$729,882
|
$770,488
|
|
Burlington
|
95
|
115 |
$1,060,276
|
$1,088,551
|
|
Dunnville
|
8
|
10 |
$496,125
|
$502,150
|
|
Cayuga
|
3
|
4 |
$1,054,000
|
$640,000
|
|
Caledonia
|
6
|
19 |
$653,667
|
$757,616
|
|
Hagersville
|
3 | 4 | $530,000 |
$496,667
|
|
Seneca
|
1
|
1 |
$910,000
|
$1,625,000
|
|
Rainham
|
1
|
0 |
$430,000
|
$000,000
|
|
Grimsby
|
19
|
17 |
$584,868
|
$921,000
|
|
West Lincoln
|
3
|
10 |
$585,667
|
$703,740
|
Note: Numbers of sales represent sales reports on properties listed on the Multiple Listing Service (MLS®) of the REALTORS® Association of Hamilton-Burlington. The average price is calculated by dividing the total dollar volume of sales (not shown) by the number of sales in that month.
Year-To-Date Market Context
With January representing the first month of the year, year-to-date figures currently reflect January activity alone. The Hamilton-Burlington market is showing early signs of stability, with a slight month-over-month increase in sales despite year-over year declines.
Hamilton-Burlington Area Highlights
- Home sales increased 0.4% month-over-month
- New listings increased 119.9% month-over-month
- Inventory increased 23.1% year-over-year
- Months of supply ended January at 3.2 months
Local Market Observations
A brief weather warm-up early in January appeared to encourage both buyer activity and new listings. However, heavier snowfall and extreme cold later in the month slowed momentum. Buyers became more cautious as travel conditions worsened and snow accumulation limited street parking in many neighbourhoods.
Some current sellers are feeling this pause in buyer activity, while many potential sellers appear inclined to wait for milder weather and improved accessibility before listing.
Want A Closer Look?
Request a Neighbourhood-Specific Market Analysis
See how your street or community compares to the broader Hamilton market.
Sign up for my Weekly Hamilton MarketWATCH Newsletter
A short weekly update with local stats, trends, and all new listings.
Get Instant Hamilton Home Listing Notifications
Be alerted as soon as homes matching your criteria hit the market.
Explore Hamilton Real Estate Trends
Understand how today’s market fits into the bigger picture.
View Hamilton real estate price history since 1990
Explore long-term pricing trends and market cycles.
Disclaimer: The statistics provided are based on information from the ITSO MLS® System, of which Cornerstone is a proud founding member. Multiple MLS® Systems operate within Ontario, and while none can be guaranteed to include every property listed or sold within a given area, they effectively illustrate market trends. Cornerstone cautions that these statistics can help identify long-term trends but should not indicate that specific properties have increased or decreased in value. Those requiring specific information on property values should contact a REALTOR®. REALTORS® have their fingers on the pulse of the market and have access to more comprehensive tools and analytics. They know the questions to ask, the areas to probe and what to look for to get a complete picture of the property and community you’re considering.
