January 2023 Hamilton ON. Real Estate
January 2023 Sales have dropped almost 26% since a year ago. New Listings are continuing to rise. Average prices continued to decrease since the peak in February of 2022, and have dropped 25% from where they were a year ago. The current inventory levels throughout the REALTORS® Association of Hamilton-Burlington (RAHB) market area are comparable to what we saw pre-pandemic, which is due to the higher interest rates and the rise in new listings. Higher supply is allowing for more choices for Buyers and we are continuing to see sales conditional on financing and home inspection.
January 2023 had 1116 Total Residential Listings come through the Hamilton Real Estate Board as reported by The REALTORS ® Association of Hamilton-Burlington (RAHB). Hamilton had 666 of those (up from 536 in 2022) and Burlington’s share was 239, up from 187 in January last year. Overall New Listings have increased by 92% since last month and have increased 29% over January 2022.
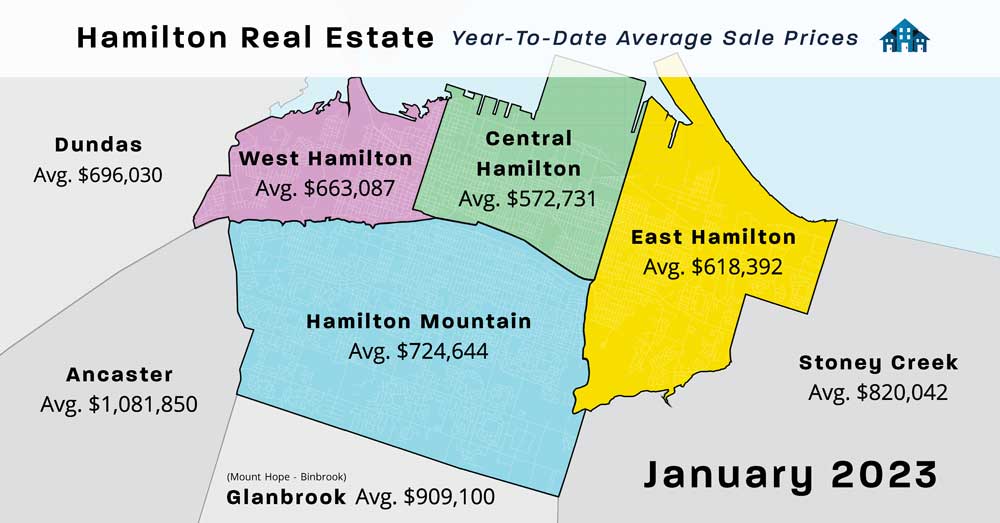
Residential Sales located throughout the RAHB market area (including Burlington and all the outlying areas covered by The REALTORS ® Association of Hamilton-Burlington) of 540 Properties are down 25.6% from January 2022, and are up 15% over last month, December 2022. The overall average price for residential properties decreased from last month ($805,162) to $791,551, and is down 25% from January 2022. Hamilton’s Residential Sales (including Flamborough, Dundas, Ancaster, Waterdown, Stoney Creek and Glanbrook) were 349, down 22% from 292 in December 2022, with an average price of $750,529 down 22% from the same month last year, and remained close to the same from last month. Burlington had 112 Sales which is down 27% from 154 last year, with an average price of $908,321 which is down 34% from January 2022, and decreased 11% over last month.
The end-of-month listing inventory which is a good indication of the type of market currently being experienced has dropped a bit from last month and now sits at 939 Active Residential Listings giving Hamilton just over two and half months of supply, which is up 283% over January 2022. Burlington increased from last month and now has 280 Active Residential Listings which gives it 2.5 months of supply, up 300% from the same time last year. Overall, the number of Active Listings Available at the end of the month now sits at 1589 properties for sale, which is 2.88 months supply, compared to only 877 properties and just over one-half months of supply in January 2022, and down slightly month over month from 1611 and 3.37 in December 2022. The average days on the market also show that it is taking longer to sell a home. It went from 13 to 37 days in Hamilton year over year, and in Burlington from 9 to 30 days.
The Hamilton-Burlington Area continues experiencing a Balanced Market, where the ratio of Homes Sold to Homes Listed is between 40% and 60%, currently sitting at 48% (about 5 homes sold for every 10 listed). Important Note: If you are currently looking for a property, ask your REALTOR® to show you the history of any property you are interested in. This will give you valuable information about how long the property has actually been for sale, when/if the price was adjusted, and possibly how much it sold for previously!
|
Buyers Market
Below 40%
|
Balanced Market
Between 40% and 60%
|
Sellers Market
Above 60%
|
|
(Ratio of Homes Sold to Homes Listed)
|
||
For the Complete Article Click Here