
Jan to June 2019 Years to Date Statistics Hamilton
January – June 2019 Year to Date Statistics & Analysis
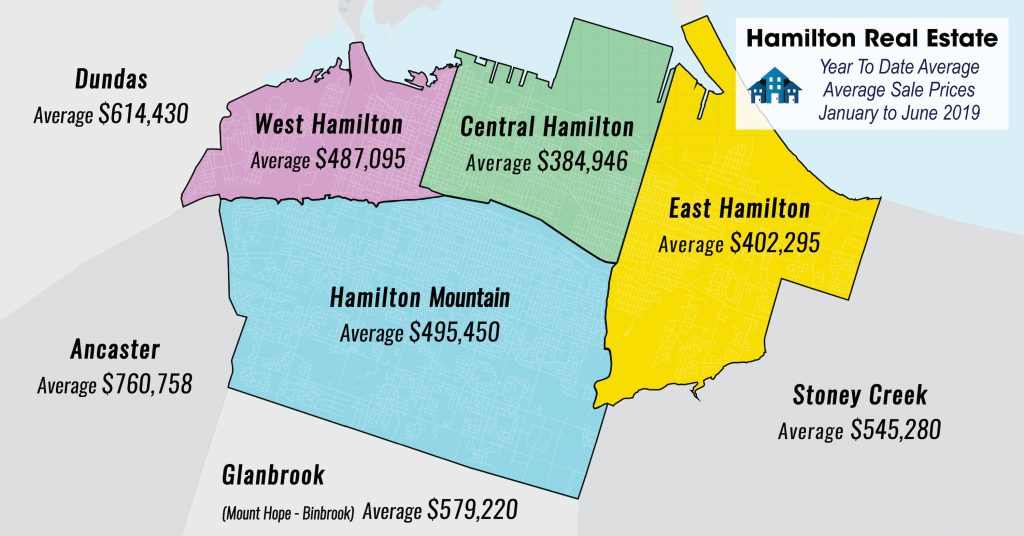
Hamilton Real Estate Housing Market Report
June 2019 had 1209 Residential Listings come through the Hamilton Real Estate Board which was slightly lower than June 2018 (1252) as reported by The REALTORS ® Association of Hamilton-Burlington (RAHB). Burlington is also down from last year, by 4% with only 414 New Listings (431 in June 2018).
Residential Sales located throughout the RAHB market area (including Burlington and all outlying areas covered by RAHB) of 1203 Properties were up this month, a 4.2% increase from the same month last year and down 10.5% over May 2019 and down 1.9% over April 2019. Residential Sales in Hamilton (which includes Hamilton plus Flamborough, Dundas, Ancaster, Waterdown, Stoney Creek and Glanbrook) were 789 of that total. The Average Hamilton Residential Sales Price of properties sold through the RAHB Multiple Listing Service® (MLS) system in June 2019 was $538,106 up 5% from the same month last year. Burlington is down 5% to $786,667. The end of month listing inventory shows 1656 Active Residential Listings, giving Hamilton 1.9 months of inventory, which is down 10% compared to 1846Properties still available for sale at the end of June last year which was 2.6 months of inventory. Burlington has 1.9 months of inventory (down 109%) with 541 active listings for sale. Average days on the market decreased from 27.5 to 25.5 this month for Hamilton, and alsodecreased in Burlington from 28 to 25.0.
Click Here for full details of current and past statistic reports… HamiltonRealEstateStatistics.com
