
Hamilton Real Estate Market Report For November 2018
Here’s What Happened For November 2018
November 2018 showed 813 New Residential Listings came on the Hamilton Real Estate Market. This is 20% LOWER than November 2017 as reported by the REALTORS® Association of Hamilton-Burlington (RAHB). Burlington is down 24% with only 270 New Listings.
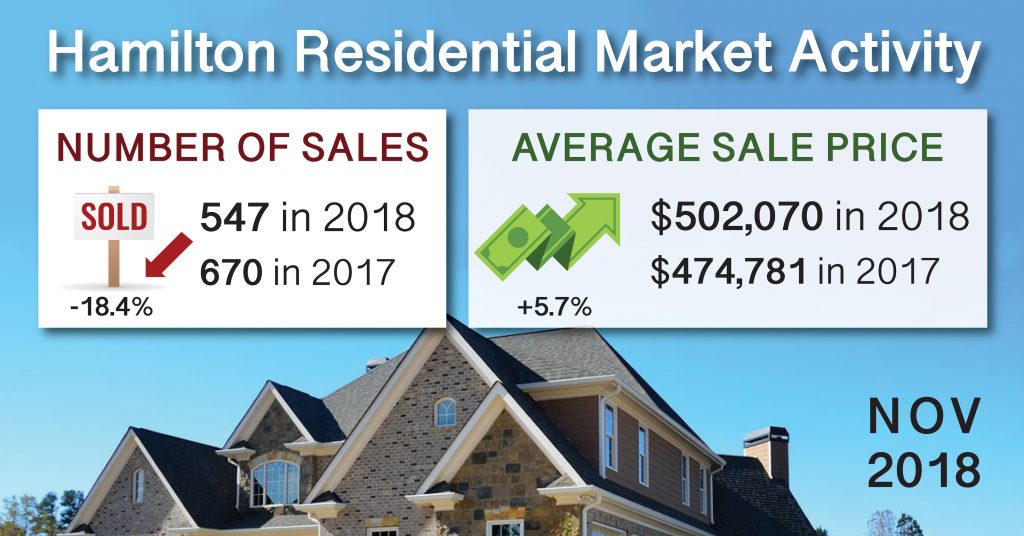
Residential Sales located throughout the RAHB market area (including Burlington and all outlying areas covered by RAHB) of 862 Properties were down by 17.1% from the same month last year. Residential Sales in Hamilton (which includes Hamilton + Flamborough, Dundas, Ancaster, Waterdown, Stoney Creek and Glanbrook) were 547 of that total. The Average Hamilton Residential Sales Price of properties sold through the RAHB Multiple Listing Service® (MLS) system in November 2018 was $502,070 up 6% from $474,781 the same month last year. Burlington which is up 4% at $726,713. The end of month listing inventory shows 1594, giving Hamilton 2.9 months of inventory, which is up 22% compared to 1310 Properties still available for sale at the end of November last year which was 2 months of inventory. Burlington has 2.2 months of inventory (up 2%) with 467 active listings for sale. Average days on the market increased from 33 to 36 this year for Hamilton and increased in Burlington from 32.9 to 38.2.
The Hamilton – Burlington Areas is still at the lower end of a Sellers Market, where the ratio of Homes Sold to Homes Listed is over 60%, currently sitting at 71.2% for Residential, (in other words, 7 homes are sold for every 10 new listings). Homes Sold to Homes Listed Ratio: Buyers Market is below 40%, Balanced Market is between 40-60%, and Sellers Market is above 60%.
If you would like more information please read the complete article on Hamilton and Surrounding Areas Sold Statistics – Click Here. Or by visiting HomesInHamiltonOntario.com
