Hamilton Real Estate Market Report for May 2018
Hamilton Real Estate Market Report for May 2018
May 2018 showed 2598 New Listings come on the Hamilton Real Estate Market from ALL Property Types (2438 From Residential Only). This is 19.8.0% LOWER than May 2017 (19.8% lower for Residential Only as well), but 5.4% HIGHER than the 10-year average, as reported by The REALTORS ® Association of Hamilton-Burlington (RAHB).
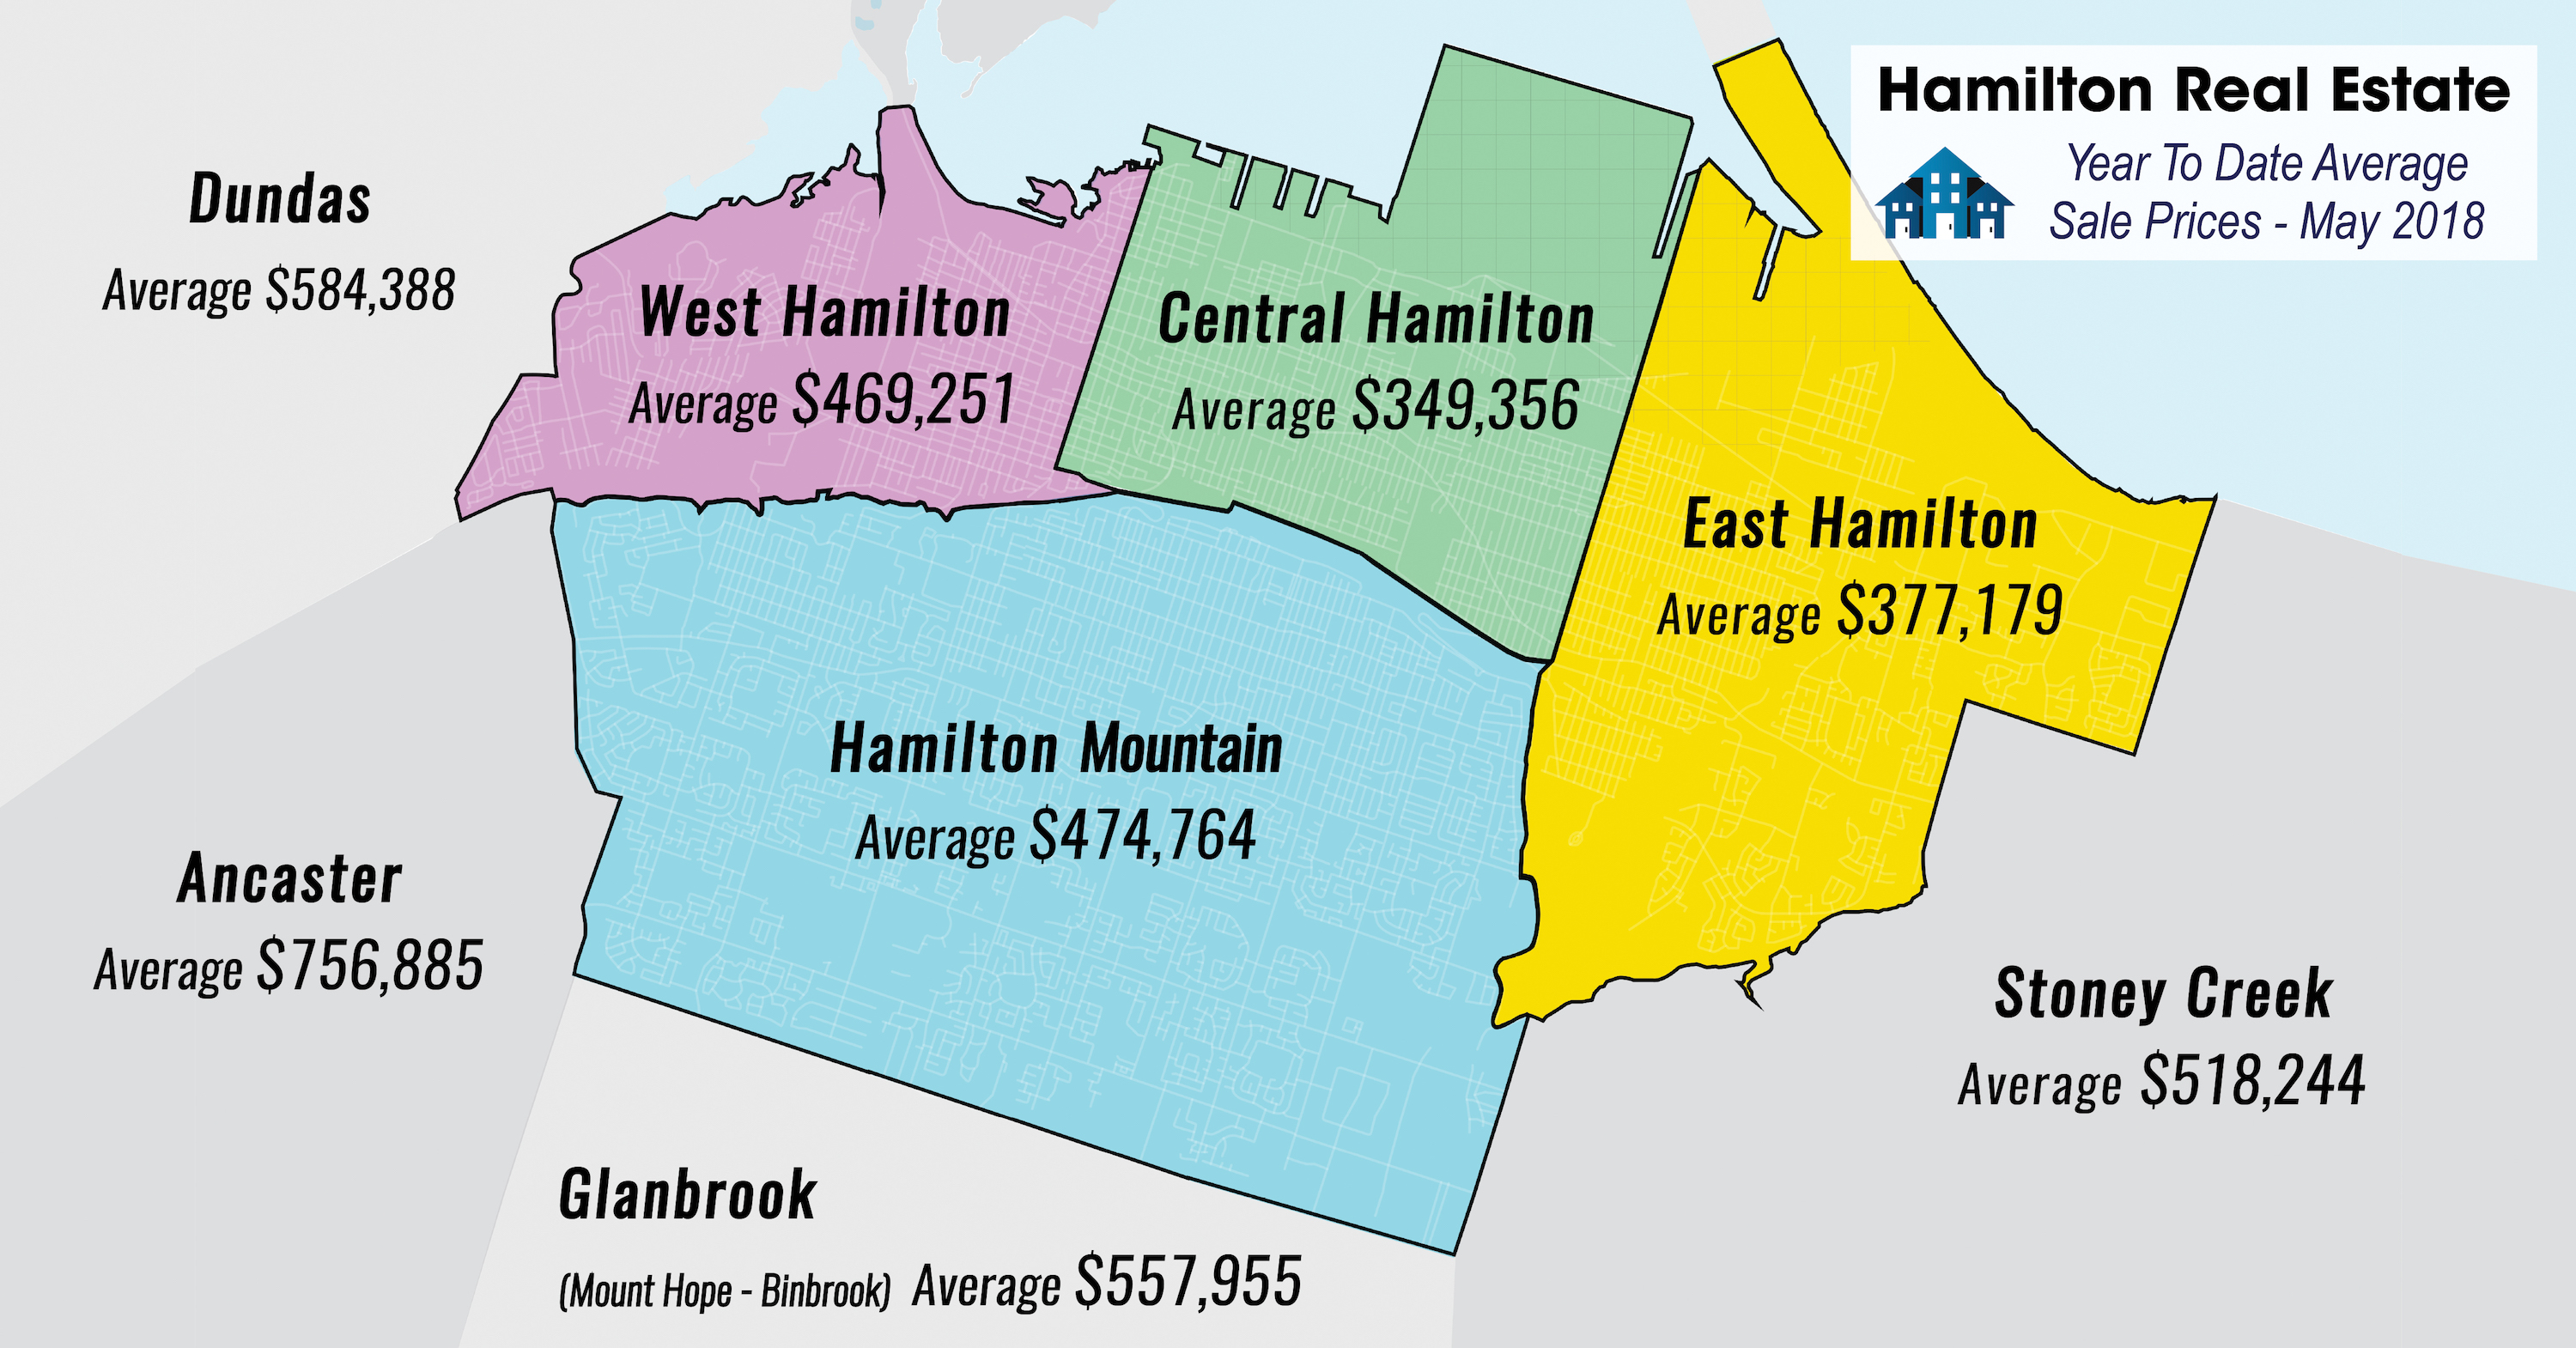
All Residential Only Sales of 1273 Properties were down by 26.2% from the same month last year. The Average Residential Sales Price of properties sold through the RAHB Multiple Listing Service® (MLS) system in May 2018 was $564,776 compared to $615,815 the same month last year, a decrease of 8.3%. That is broken down between Residential Freehold Average Price of $600,452 (down from $656,057 in May 2017) and the Condominium Average Price at $422,348 (up slightly from $419,272 in May 2017). The end of month listing inventory shows 2547 Freehold Residential Properties left for sale, up only 21.6% compared to 2094 still available for sale at the end of May last year. Average days on the market increased from 16 to 27 for Freehold in May this year, and from 16 to 28 for Condominiums.
The Hamilton – Burlington Areas are showing they are maintaining a Balanced Real Estate Market, where the ratio of Homes Sold to Homes Listed is between 40% and 60% (in other words 4-6 homes are sold for every 10 new listings). What this means to Sellers is that they have more competition and that houses are sitting on the market longer, so pricing your home correctly is crucial! For buyers, it means there is usually more time to look at homes and there is more to choose from. Most homes are taking offers with conditions (unlike in the peak of a Sellers Market, where most Offers To Purchase were Firm, with no conditions). This is all price dependent of course. Right now there is a shortage of homes listed for sale under $400,000 so the segment of the market is acting more like a Sellers Market. Here is a comparison chart looking back over the last 3 years at what the market looked like in May, which is usually the peak of the Spring Market, for the Residential Freehold Homes.
| Year | Average Residential
Freehold Prices |
Sales to New
Listing Ratio |
Type of Market |
| May 2016 | $498,223 | 85.4% | Sellers Market |
| May 2017 | $615,815 | 56.7% | Balanced Market |
| May 2018 | $564,776 | 52.2% | Balanced Market |
For more information click here


