
Hamilton Real Estate 2018 Sept Market Report
Hamilton Real Estate September 2018 Market Report
September 2018 showed only 1208 New Residential Listings came on the Hamilton Real Estate Market This is 9% LOWER than September 2017 as reported by The REALTORS ® Association of Hamilton-Burlington (RAHB). Burlington is down 11% with 472 New Listings.
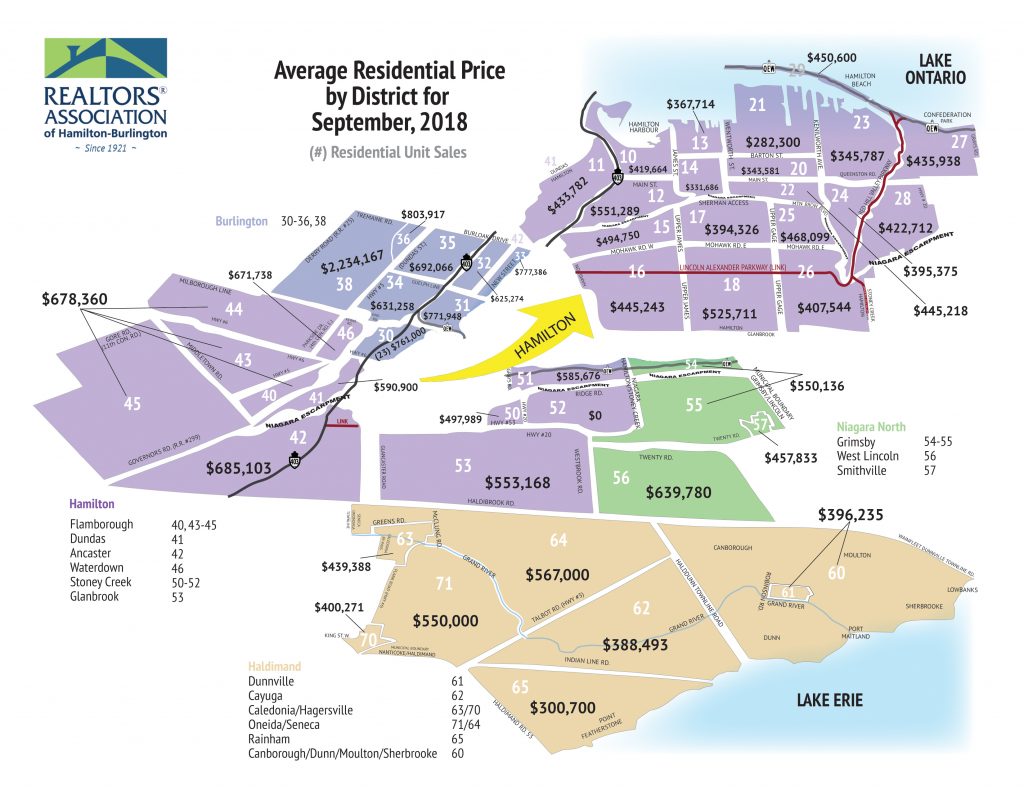
Residential Sales located throughout the RAHB market area (including Burlington and all outlying areas covered by RAHB) of 948 Properties were up by 4.6% from the same month last year. Residential Sales in Hamilton (which includes Hamilton + Flamborough, Dundas, Ancaster, Waterdown, Stoney Creek and Glanbrook) were 571. The Average Hamilton Residential Sales Price of properties sold through the RAHB Multiple Listing Service® (MLS) system in September 2018 was $501,201 up 2% from $489,102 the same month last year, compared to Burlington which is down 2% at $746,812. The end of month listing inventory shows 1842, giving Hamilton 3.2 months of inventory, which is up 23% compared to 1494 Properties still available for sale at the end of September last year which was 2.5 months of inventory. Burlington has 2.4 months of inventory (down 0.5%) with 595 active listings for sale. Average days on the market decreased for the first time in quite a while from 34.3 to 31.8 this year for Hamilton and increased 3.1% in Burlington from 28.9 to 32.1.
The Hamilton – Burlington Areas is currently experiencing a Balanced Market, where the ratio of Homes Sold to Homes Listed is 40%-60%, currently sitting at 50.1% for Residential, (in other words 5 homes are sold for every 10 new listings). Homes Sold to Homes Listed Ratio: Buyers Market is below 40%, Balanced Market is between 40-60%, and Sellers Market is above 60%.
