February 2020 Real Estate Sold Statistics Hamilton
Hamilton Ontario Real Estate Market Report for February 2020
February 2020 had 1355 Total Residential Listings come through the Hamilton Real Estate Board, which is down from the 1264 Listings in February 2019, as reported by The REALTORS ® Association of Hamilton-Burlington (RAHB). Hamilton had 894 of those (up from 804 in 2019) and Burlington’s share was 323 (up a little from 321 in February 2019).
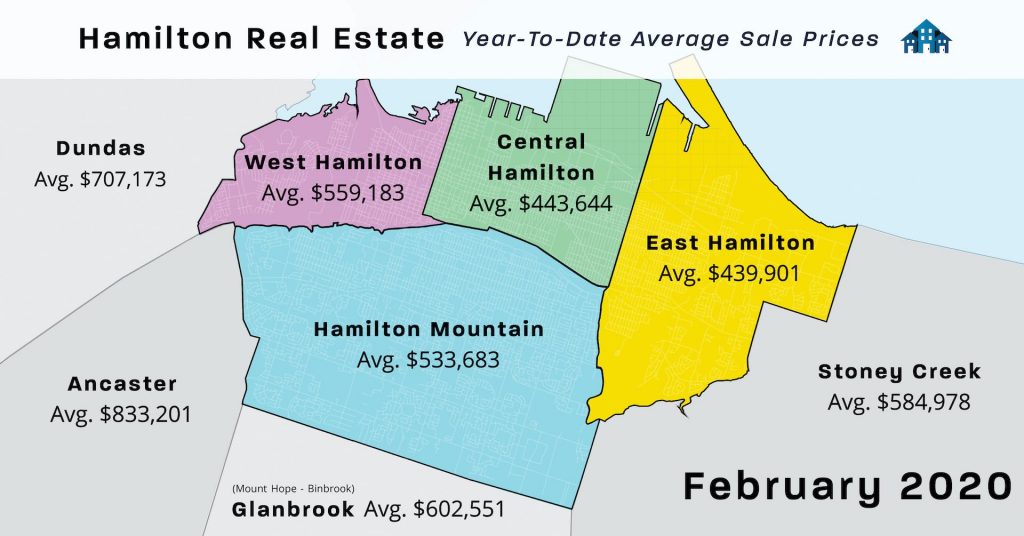
Residential Sales located throughout the RAHB market area (including Burlington and all the outlying areas covered by The REALTORS ® Association of Hamilton-Burlington) of 998 Properties are up 25.5% from February 2019 and up 30% from last month, January 2020. The overall average price for residential properties increased by 15.5% from February 2019 to $646,667. Hamilton’s Residential Sales (including Flamborough, Dundas, Ancaster, Waterdown, Stoney Creek and Glanbrook) were 664, up 27% from 523, with an average price of $588,817 up 14% from February 2019. Burlington had 223 Sales which is up 18% from 198, with an average price of $839,446 which is up 23% from February 2019.
The end of month listing inventory which is a good indication of the type of market currently being experienced shows 859 Active Residential Listings giving Hamilton 1.3 months of inventory, down 9% from February 2019. Burlington has 277 Active Residential Listings giving it 1.2 months of inventory, down 18%. Average days on the market dropped from 34.1 to 24.2 in Hamilton and also decreased in Burlington from 27.1 to 16.9. Right now the Hamilton-Burlington Area is sitting firmly in a Strong Sellers Market, where the ratio of Homes Sold to Homes Listed is above 60%, currently sitting at 73.7%. In other words, 7.3 homes are sold for every 10 new listings.
Homes Sold to Homes Listed Ratio: Buyers Market is below 40%, Balanced Market is between 40-60%, and Sellers Market is above 60%. For the rest of the article – Click Here