Dec Year to Date 2018 Real Estate Sold Statistics for Hamilton

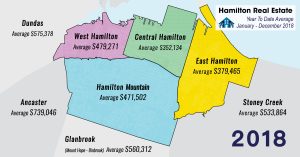
Hamilton Real Estate Housing Market Report
January to December 2018 Year-To-Date Analysis and Statistics

2018 was a very different market throughout the Hamilton-Burlington Real Estate Board, compared to 2107 and 2016. The chart above shows a couple of the major changes year over year. Overall the numbers show a decrease in the average sales price from 2017, however, if you dig deep into the districts and neighbourhoods you will see that prices went UP in Hamilton and Glanbrook and DOWN in Ancaster, Dundas, Grimsby, Waterdown and Burlington. (See detailed neighbourhood charts below). The average selling price peaked in most areas in Spring 2017. Since then there has been some balancing in the higher priced districts and some continued growth in prices in the lower priced neighbourhoods. Although prices went down about 1.4% from 2017, they went up 90% from ten years ago in 2008

Sales activity for 2018 was also down – 17.6% from 2017 and down 12.2% from 10 years ago. Inventory at the end of 2018 was higher than it was in both 2017 and 2016, however, it is almost half of what was available a decade ago. Residential inventory was 26,414 in 2018 compared to 43,197 at the end of 2008. Most of 2018 experienced a Sellers Market and closed out the year at the high end of a Balanced Market, 59.57% right on the verge of a Sellers Market. To put it in perspective, the last time Hamilton experienced a Balanced Market was in 2010 and the last time for a Buyers Market was in 1995! Homes Sold to Homes Listed Ratio:  Buyers Market is below 40%, Balanced Market is between 40-60%, and Sellers Market is above 60%.
When looking at the Average Prices in and around Hamilton, it is important to note how they are changing significantly, not only from city to city but even within districts and neighbourhoods! For instance, Hamilton Mountain had 3 of 6 districts that went up in price and 3 of sic that went down in price. Furthermore, the style of homes will also indicate whether prices are balancing, lowering, or rising. One floor detached homes (bungalows and raised ranch styles) are still at a premium as well as 1 Floor Condominium Townhomes, even though the average price dropped a bit. There were 5670 Freehold Bungalows that sold in 2018 at an average price of $505,850, down from the 5267 Sold in 2017 at an average price of $523,737. There are still multiple offers happening in the lower end of the price range, and especially on the 1-floor style properties.
If you are thinking of selling your house or condominium, get the most up to date, LOCAL information. A Market Evaluation and/or a Mortgage Pre-Approval done even a couple of months ago MUST be updated, with a very localized look at your particular neighbourhood.   

For the rest of the January to December 2018 Year to date article – Click Here.