April 2026 Hamilton Real Estate Statistics
Residential Real Estate Statistics | Hamilton, Burlington & Area
Year-to-Date Average Price – April 2026
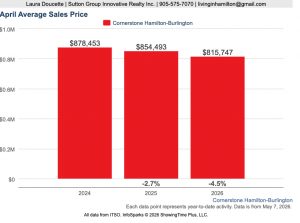
Source: ITSO / Showing Time – Live MLS Market Activity
Year-To-Date Residential Prices – April 2026
With the first four months of the year now complete, these figures reflect combined market activity for January through April.
Hamilton
$739,752
Burlington
$1,064,533
Average price statistics give you a useful read on overall market direction. Pricing performance can vary significantly by neighbourhood, property type, and price range, which is why local market analysis matters when you are looking at a specific property.
Market Overview – April 2026
The spring numbers are here and they show real movement. Sales were up nearly 15 percent from March, new listings jumped over 20 percent, and prices ticked up month-over-month. Sellers are not panicking.
The year-over-year picture is where you get the fuller story. Sales are flat compared to April 2025. Prices are down across the board. At a 41% SNLR, the market is sitting right at the line between balanced and buyers territory.
Inventory has increased compared to February, giving buyers more choice and more time to make decisions. At the same time, homes that are priced correctly are still selling, often without sitting long.
“As spring momentum continues, the Hamilton-Burlington housing market is showing positive conditions that create opportunities for both sides of a transaction. With sales up nearly 15 per cent from last month and new listings up over 20 per cent, the market is finding its footing as we head into what is traditionally one of the busiest times of the year for real estate.” — Bill Duce, CEO, Cornerstone Real Estate Board
Buyers have more options than they have had in years, and more time to use them. Sellers who price correctly are still moving product. Those who don’t are sitting.
Sales Activity
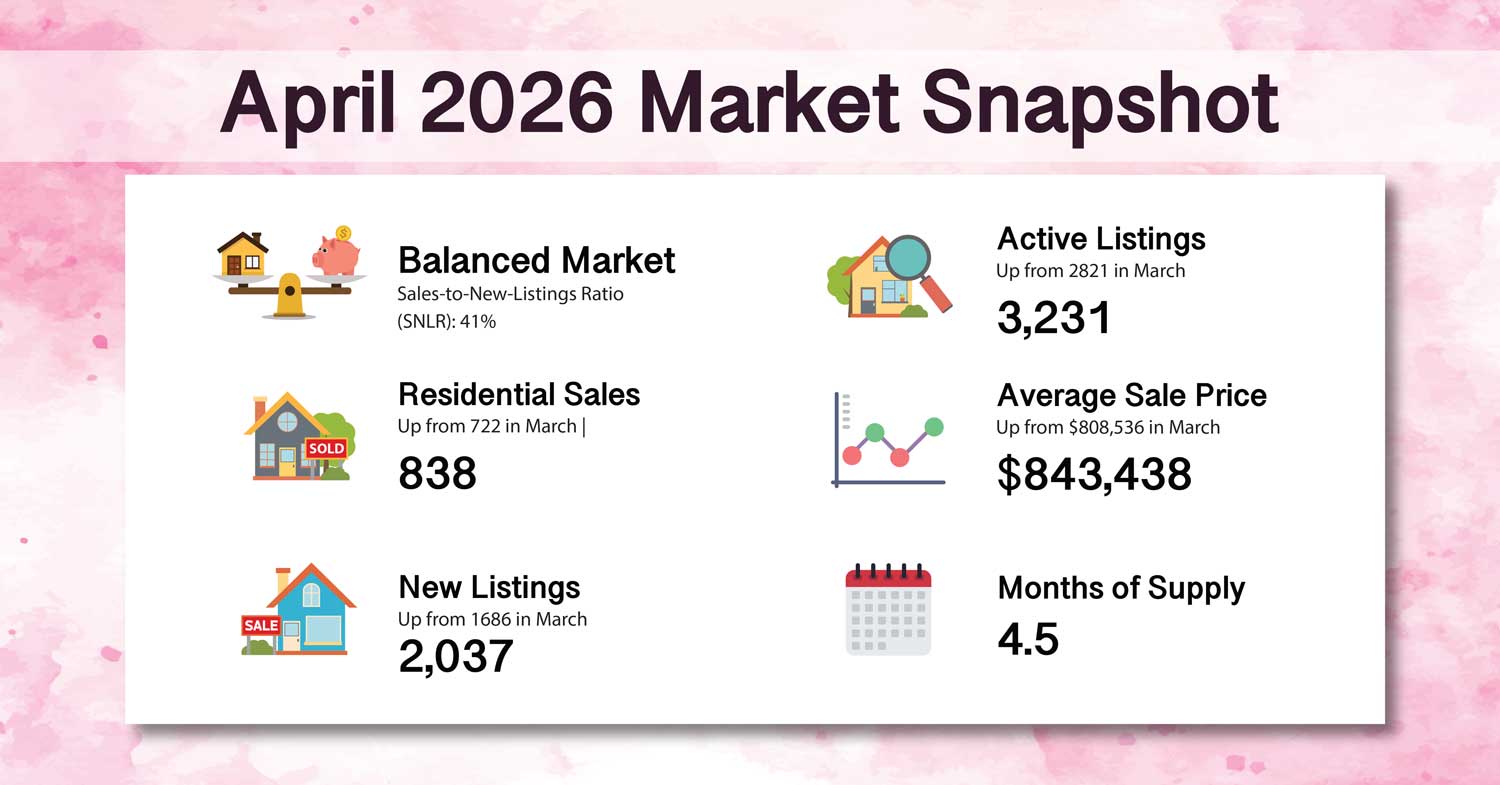
838 residential properties sold across the Hamilton-Burlington-Haldimand-Niagara North region in April.
- Up 14.7% from 722 sales reported for March 2026
- Flat compared to 838 sales in April 2025
By Area
- Hamilton: 514 sales (down from 546 last year)
- Burlington: 210 sales (up from 168 last year)
Burlington’s year-over-year volume gain stands out. Up 25% from last April on a corrected price base. Deman there remains firm
Pricing Trends
The average residential sale price in April was $843,438, up from $808,536 in March and down from $874,692 in April 2025.
| Area | April 2026 | April 2025 | Change |
| Region | $843,438 | $874,692 | -3.6% |
| Hamilton | $777,465 | $794,775 | -2.2% |
| Burlington | $1,047,968 | $1,181,942 | -11.3% |
Hamilton is holding relatively well, off 2.2% year-over-year. Burlington has pulled back more sharply, down 11.3% from last April. That reflects affordability pressure at that price point and a correction from an unusually strong spring in 2025.
The MLS Home Price Index, which controls for property mix, increased 1.4% month-over-month and is down 7.7% year-over-year.
Month-to-month price movements will always fluctuate. Average sale price is best read as a trend indicator, not a precise valuation tool. Right now the trend continues to show prices adjusting compared to last year, with real variation depending on where you are and what you are buying.
New Listings
2,037 new residential listings came to the market in April.
-
Up 20.3% from 1,686 listings in March
-
Down 4.9% compared to 2,142 in April 2025
By Area
- Hamilton: 1,305 new listings (down from 1,353 last year)
- Burlington: 432 new listings (down from 446 last year)
The spring surge in new listings is normal. It is giving buyers more to work with, and that’s showing up in the numbers.
Inventory and Months of Supply
Active listings reached 3,231 by the end of April, up from 2,821 in March and down 4.7% from 3,392 in April 2025.
Area – Months of Supply
- Region: 4.5
- Hamilton: 4.6
- Burlington: 3.6
Months of supply moved from 3.9 in March to 4.5 in April because new listings came in faster than sales absorbed them. Burlington at 3.6 months is the tightest pocket in the region. Across the board, these numbers support balanced conditions. Neither side has a commanding advantage right now.
Days On Market
Homes are taking an average of 21 days to sell, down from 24 days in March
- Hamilton: 21 days (up from 20 days in April 2025)
- Burlington: 18 days (up from 17 days in April 2025)
Homes are moving faster than they were last month. The slight year-over-year increase in both areas reflects buyers taking more time, because they have more choices.
Market Definitions (Sales-to-New-Listings Ratio)
Buyer’s Market: Below 40% Balanced Market: 40%–60% Seller’s Market: Above 60%
April 2026 SNLR: 41%, placing the market within Balanced Market conditions.
838 sales against 2,037 new listings puts the SNLR at 41%. That is technically balanced, but it is sitting right at the threshold. Buyers have more leverage than that label suggests. Correctly priced homes are selling. Everything else is grinding.
Property Type Insights
Variation across property types and price ranges continues to be a theme.
Buyers have more flexibility than they have had in recent years, particularly where inventory has built up. Well-priced homes in strong locations are still getting attention and selling in reasonable timeframes.
April 2026 Residential Sales & Average Prices By Area
(Current Month Vs Prior Year)
RAHB Market Activity |
Number of Sales Apr 2026 |
Number of Sales Apr 2025 |
Average Sale Prices in Apr 2026 |
Average Sale Price Apr 2025 |
|
West Hamilton
|
45
|
37
|
$779,246
|
$731,498
|
|
East Hamilton
|
54
|
63 |
$539,802
|
$590,941
|
|
Central Hamilton
|
62
|
62 |
$527,234
|
$572,007
|
|
Hamilton Mountain
|
128
|
129 |
$699,349
|
$686,129
|
|
Flamborough
|
17
|
18 |
$1360,900
|
$1,196,814
|
|
Dundas
|
19
|
40 |
$899,233
|
$982,457
|
|
Ancaster
|
56
|
39
|
$1,014,035
|
$1,338,269
|
|
Waterdown
|
32
|
32
|
$1,171,153
|
$990,353
|
|
Stoney Creek
|
74
|
82 |
$760,287
|
$790,832
|
|
Glanbrook
|
27
|
33 |
$840,307
|
$848,995
|
|
Burlington
|
210
|
168 |
$1,047,968
|
$1,181,942
|
|
Dunnville
|
16
|
15 |
$611,125
|
$699,172
|
|
Cayuga
|
3
|
7 |
$975,000
|
$849,143
|
|
Caledonia
|
11
|
16 |
$760,445
|
$722,956
|
|
Hagersville
|
1 | 10 | $417,500 |
$587,600
|
|
Grimsby
|
33
|
28 |
$826,098
|
$924,563
|
|
West Lincoln
|
14
|
21 |
$924,781
|
$900,381
|
Note: Numbers of sales represent sales reports on properties listed on the Multiple Listing Service (MLS®) of the REALTORS® Association of Hamilton-Burlington. The average price is calculated by dividing the total dollar volume of sales (not shown) by the number of sales in that month.
Notable movements this month:
Ancaster sales jumped 44% year-over-year (56 vs 39) while the average price dropped from $1,338,269 to $1,014,035. More transactions, but a shift toward lower price points in what sold.
Flamborough went the other direction. Average prices were up 13.8% year-over-year on steady sales volume.
Waterdown posted an 18.3% price gain on identical sales volume. One of the stronger individual pricing stories in the region this month.
Dundas saw sales cut in half (19 vs 40) with prices also declining. Worth watching heading into May.
Burlington was up 25% in sales volume with prices down 11.3%. High activity at a corrected price level.
Year-To-Date Market Context
Four months into 2026, the picture is consistent:
- Sales are recovering month-over-month as spring activity builds
- Inventory is supporting balanced-to-buyers conditions across most of the region
- Prices are adjusting compared to 2025, with meaningful variation by neighbourhood
- Buyers have more choice and more time than at any point in the past three years
Local Market Observations
April delivered what spring usually delivers. More listings, more sales, more activity. The 15% month-over-month sales increase and 20% jump in new listings tell you that both buyers and sellers are showing up.
What the numbers also confirm is that this market has no patience for overpriced listings. At 4.5 months of supply and a 41% SNLR, buyers have options and they are using them. Homes priced for today’s market are selling in 21 days. Homes priced for last year’s market are not.
Heading into May, the question is whether spring momentum holds or whether buyer caution keeps the SNLR pinned at the low end of balanced. The inventory is there. The demand exists. Pricing is still the deciding factor.
This is a market that rewards preparation, accurate pricing, and a clear strategy on both sides.
Looking for context? Read the March 2026 market report here.
Want a Closer Look?
Wondering what your home is worth in this market? Get a current pricing analysis for your neighbourhood.
- Request a neighbourhood-specific market analysis
- Get set up on instant listing notifications, so you see new homes the moment they hit the market
- Explore Hamilton Real Estate Trends
Hamilton Real Estate Price History Since 1990
Monthly Market Updates
Annual Market Reviews
Disclaimer: The statistics provided are based on information from the ITSO MLS® System, of which Cornerstone is a proud founding member. Multiple MLS® Systems operate within Ontario, and while none can be guaranteed to include every property listed or sold within a given area, they effectively illustrate market trends. Cornerstone cautions that these statistics can help identify long-term trends but should not indicate that specific properties have increased or decreased in value. Those requiring specific information on property values should contact a REALTOR®. REALTORS® have their fingers on the pulse of the market and have access to more comprehensive tools and analytics. They know the questions to ask, the areas to probe and what to look for to get a complete picture of the property and community you’re considering.
