Dec Year to Date 2018 Real Estate Sold Statistics for Hamilton
Hamilton Real Estate Housing Market Report
January to December 2018 Year-To-Date Analysis and Statistics
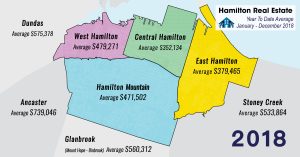
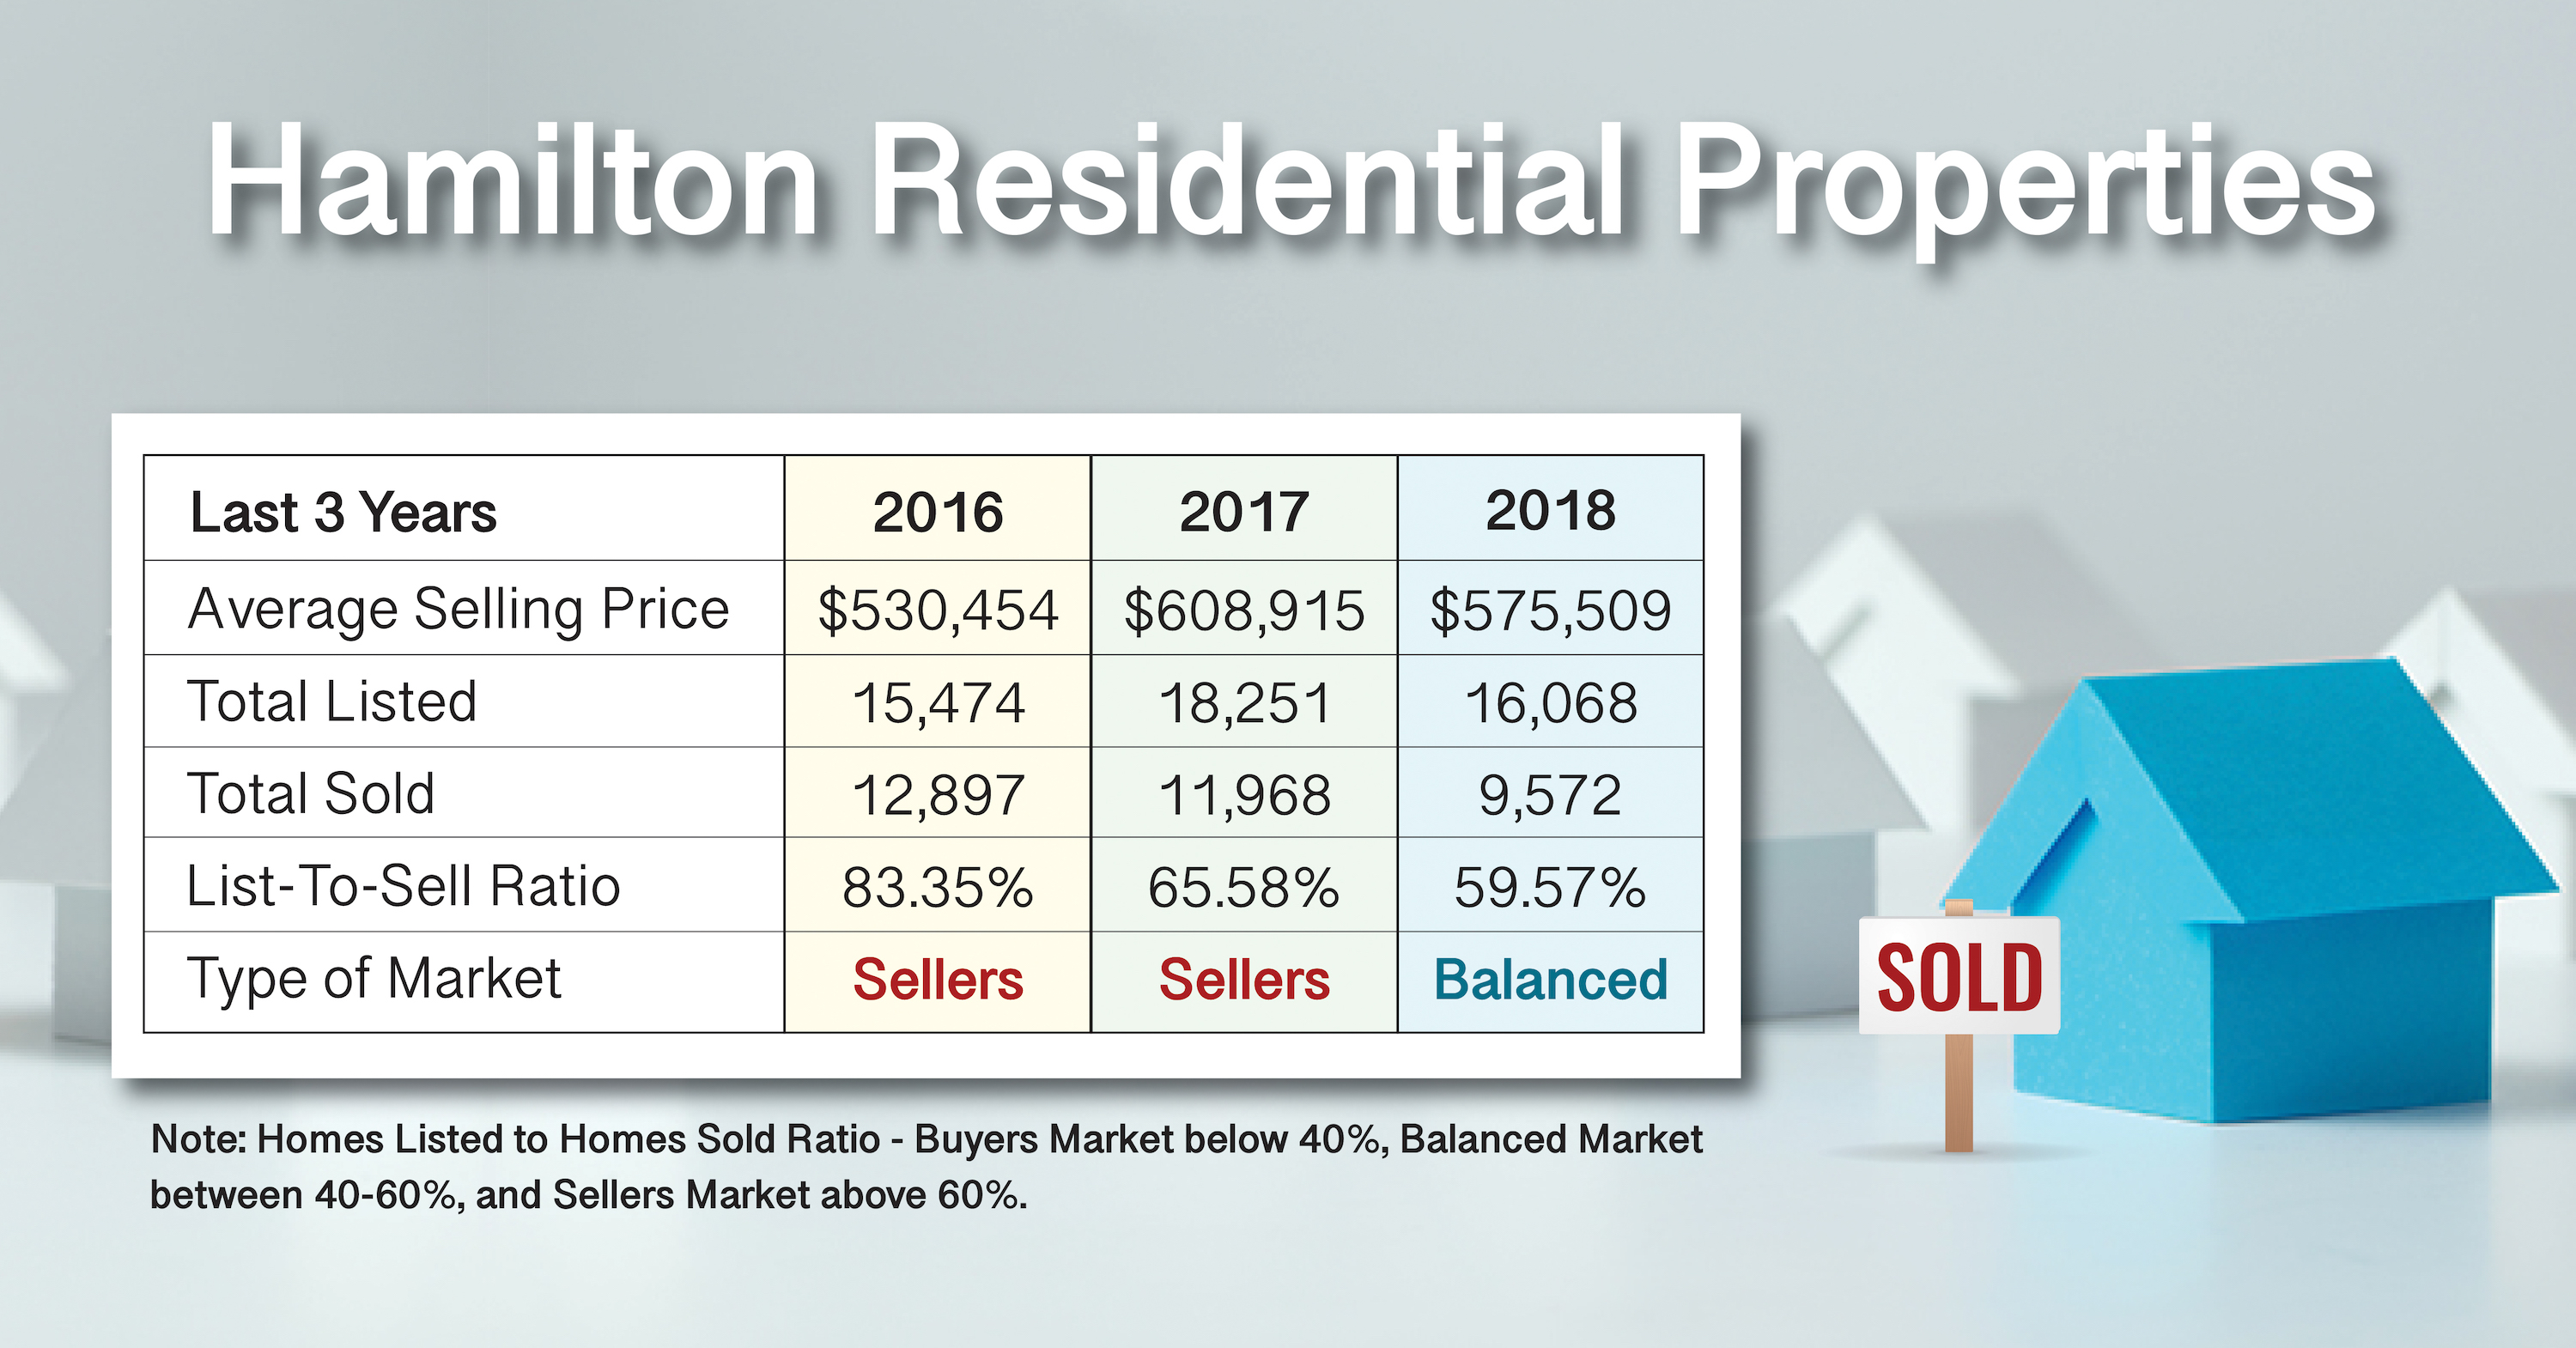
2018 was a very different market throughout the Hamilton-Burlington Real Estate Board, compared to 2107 and 2016. The chart above shows a couple of the major changes year over year. Overall the numbers show a decrease in the average sales price from 2017, however, if you dig deep into the districts and neighbourhoods you will see that prices went UP in Hamilton and Glanbrook and DOWN in Ancaster, Dundas, Grimsby, Waterdown and Burlington. (See detailed neighbourhood charts below). The average selling price peaked in most areas in Spring 2017. Since then there has been some balancing in the higher priced districts and some continued growth in prices in the lower priced neighbourhoods. Although prices went down about 1.4% from 2017, they went up 90% from ten years ago in 2008!

For the rest of the January to December 2018 Year to date article – Click Here.

