
September 2025 Real Estate Statistics
Residential Real Estate Market Report – September 2025
/\ Sales – Average Price \/ – New Listings /\ – Inventory /\
The Hamilton, Burlington, Haldimand, and Niagara North Real Estate Market continued its upward trend in September, marking the third straight month of increased sales. While sales were up 2.7% compared to last year, they still sit about 27% below long-term norms and 33% under the 10-year average. Year-to-date numbers are also 10% lower. On the positive side, new listings and overall inventory have climbed, giving buyers more choice and leverage. With a sales-to-listings ratio of 35%, we’re clearly in a Buyer’s Market, though not all areas are feeling the same impact. Some neighbourhoods are still performing above average, highlighting the value of working with a local, experienced REALTOR® who understands the nuances of each community.
Area Breakdown – Sales
- Hamilton (Including Flamborough, Dundas, Ancaster, Waterdown, Stoney Creek, and Glanbrook) recorded 475 sales in September, up 7.2% from the same month last year. Also, up from the 460 sales last month in August.
- Burlington had 165 sales, up 5% year-over-year, though slightly lower than 187 in August.
- Across Hamilton, Burlington, Haldimand County, and Niagara North combined, there were 773 sales — up from 757 in August and up 3% compared to September 2024.
Average Residential Prices
- The overall average price across the region was $826,773, which is down 5% from September 2024.
- The year-to-date average now sits at $853,846, down 3.1% year-over-year and down from last month, $858,179.
Area Breakdown – Prices
- Hamilton: $775,745 in September, down 4.8% year-over-year and down from $776,381 in August.
- Burlington: $1,056,475, down 7.6% year-over-year and down from $1,128,578 in August.
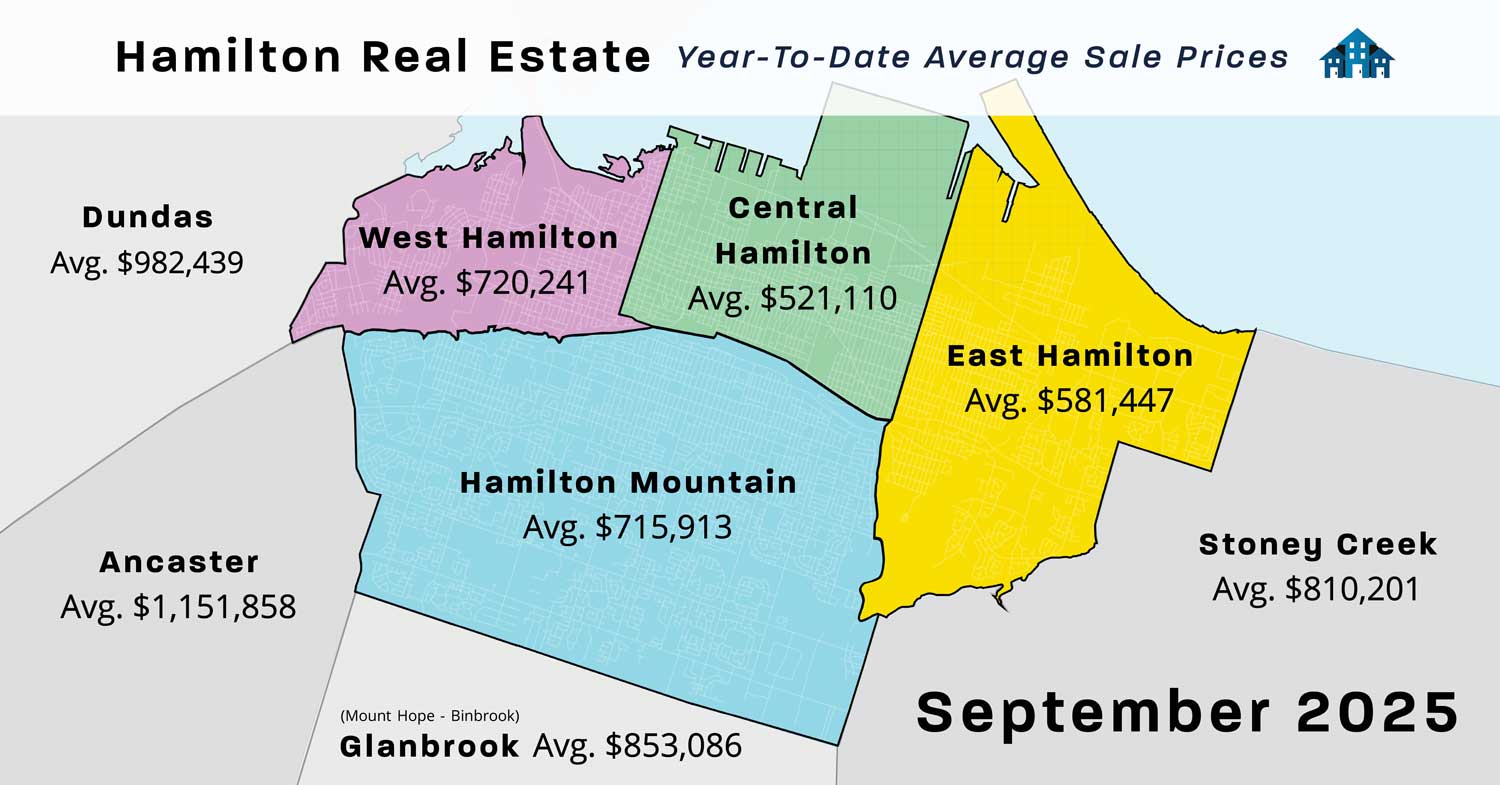
For a more detailed look at the year-to-date average prices across the Greater Hamilton Area, please see the chart and map below.
New Listings
- There were 2,188 new residential listings in September, up 1.9% compared to September 2024 and up from 1,601 in August.
- Hamilton: 1,392 listings, up 2.2% year-over-year, and up from 1,031 in August.
- Burlington: 462 listings, up 7.2% year-over-year, and up from 292 in August.
Inventory and Supply
- Active inventory across the region ended the month at 3,891 listings, up 10.5% from September 2024 and up from 3,670 in August.
- This represents 5.03 months of supply (the time it would take to sell all current listings at the current pace). That’s up 7.6% from last year and up from 4.85 months of inventory in August.
Area Breakdown – Inventory
- Hamilton: 2,487 active listings, up 13.7% year-over-year, equal to 5.24 months of supply (up from 5.07 in August).
- Burlington: 709 active listings, up 11.5% year-over-year, with 4.3 months of supply (up from 3.5 in August).
Days on Market
- Hamilton: Homes took an average of 40 days to sell — longer than August (37.1 days) and 7.6% longer than in September 2024.
- Burlington: Homes averaged 35.7 days on market — lower than 39.9 days in August and 2.1% longer than last year.
Market Status
The overall Hamilton-Burlington region has dropped into a Buyer’s Market, where less than 40% of homes listed are sold.
- In September 2025, the sales-to-listings ratio was 35%, meaning 3.5 homes sold for every 10 listed.
Buyers MarketBelow 40% |
Balanced MarketBetween 40% and 60% |
Sellers MarketAbove 60% |
|---|---|---|
|
(Ratio of Homes Sold to Homes Listed)
|
||
Breakdown of Year-to-date Average Prices For Hamilton & Surrounding Areas
The map below shows the current Year-To-Date Average Residential Prices. When looking at the Average Prices in and around Hamilton, it is important to note how they have changed significantly over the last year and even now from month to month. If you are thinking of selling your house or condominium, get the most up-to-date. Here are a few other areas that are not listed on the map below.
Hamilton – $783,507 – Down
Burlington – $1,125,658 – Down
Flamborough – $1,242,564 – Up
Waterdown – $962,580 – Down
Grimsby – $850,901 – Down
Caledonia – $750,005 – Down
Cayuga – $844,657 – Up
Dunnville – $603,560 – Down
Note that the “Average Sale Price” is based on the total dollar volume of all properties sold through the RAHB MLS® System. Average sale price can be useful in establishing long-term trends, but should not be used as an indicator that specific properties have increased or decreased in value.” What that means is, that not every house or condo has increased in price by the same percentage. It is really important to talk to an experienced local REALTOR® to see EXACTLY what is happening in your particular neighbourhood. It is also important to find out what you can do to your house to get the highest amount possible when you are ready to sell!
In this Market, it is important that you know about the houses getting listed immediatly! Click Here to get set up on the Instant Listings Notification Search, otherwise, you will only knnow about listings once they are reported to the public sites. If you wait till you see it on Realtor.ca or other sites, it’s too late, and is probably already SOLD!
MLS® Property Listings September 2025
RAHB Market Activity |
Number of Sales September 2025 |
Number of Sales September 2024 |
Average Sale Prices in September 2025 |
Average Sale Price September 2024 |
|
West Hamilton
|
25
|
34
|
$715,270
|
$788,218
|
|
East Hamilton
|
45
|
60
|
$580,634
|
$606,358
|
|
Central Hamilton
|
66
|
53
|
$451,274
|
$578,074
|
|
Hamilton Mountain
|
136
|
108
|
$708,659
|
$752,490
|
|
Flamborough
|
20
|
18
|
$1,310,350
|
$1,343,778
|
|
Dundas
|
21
|
18
|
$997,571
|
$1,001,822
|
|
Ancaster
|
45
|
41
|
$1,193,642
|
$999,168
|
|
Waterdown
|
24
|
34
|
$915,992
|
$1,017,026
|
|
Stoney Creek
|
61
|
65
|
$813,956
|
$823,436
|
|
Glanbrook
|
32
|
26
|
$806,310
|
$1,056,281
|
|
Burlington
|
165
|
159 |
$1,056,475
|
$1,140,226
|
|
Dunnville
|
22
|
17
|
$624,455
|
$536,994
|
|
Cayuga
|
6
|
6
|
$983,017
|
$735,833
|
|
Caledonia
|
16
|
13
|
$718,744
|
$731,231
|
|
Hagersville
|
8
|
10
|
$667,938
|
$594,780
|
|
Seneca
|
3
|
3
|
$1,268,333
|
$1,563,333
|
|
Rainham
|
2
|
3
|
$553,240
|
$256,667
|
|
Grimsby
|
27
|
40
|
$829,470
|
$859,031
|
|
West Lincoln
|
16
|
16
|
$795,031
|
$919,494
|
Note: Numbers of sales represent sales reports on properties listed on the Multiple Listing Service (MLS®) of the REALTORS® Association of Hamilton-Burlington. The average price is calculated by dividing the total dollar volume of sales (not shown) by the number of sales in that month.
