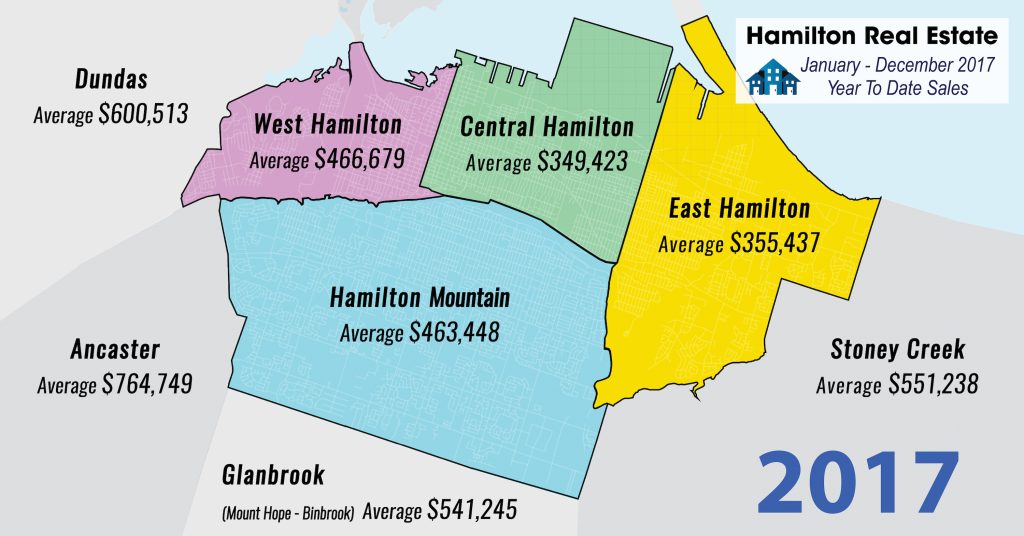
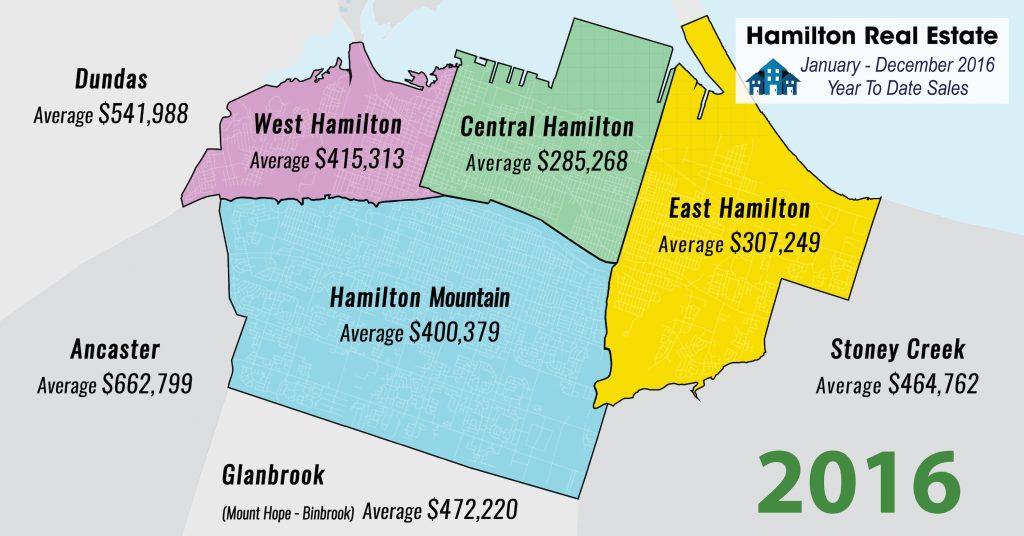
Jan to Dec 2017 Year-To-Date Hamilton Sold Statistics
2017 Year In Review
Analysis & Property Values Report!
The Canadian Real Estate Association says that there was a 4.5% increase in nationwide home sales in December compared with November, marking their fifth consecutive monthly rise. Activity increased in almost 60% of local markets with the GTA, Edmonton, Calgary, the Fraser Valley, Vancouver Island, Hamilton-Burlington and Winnipeg leading the gains.
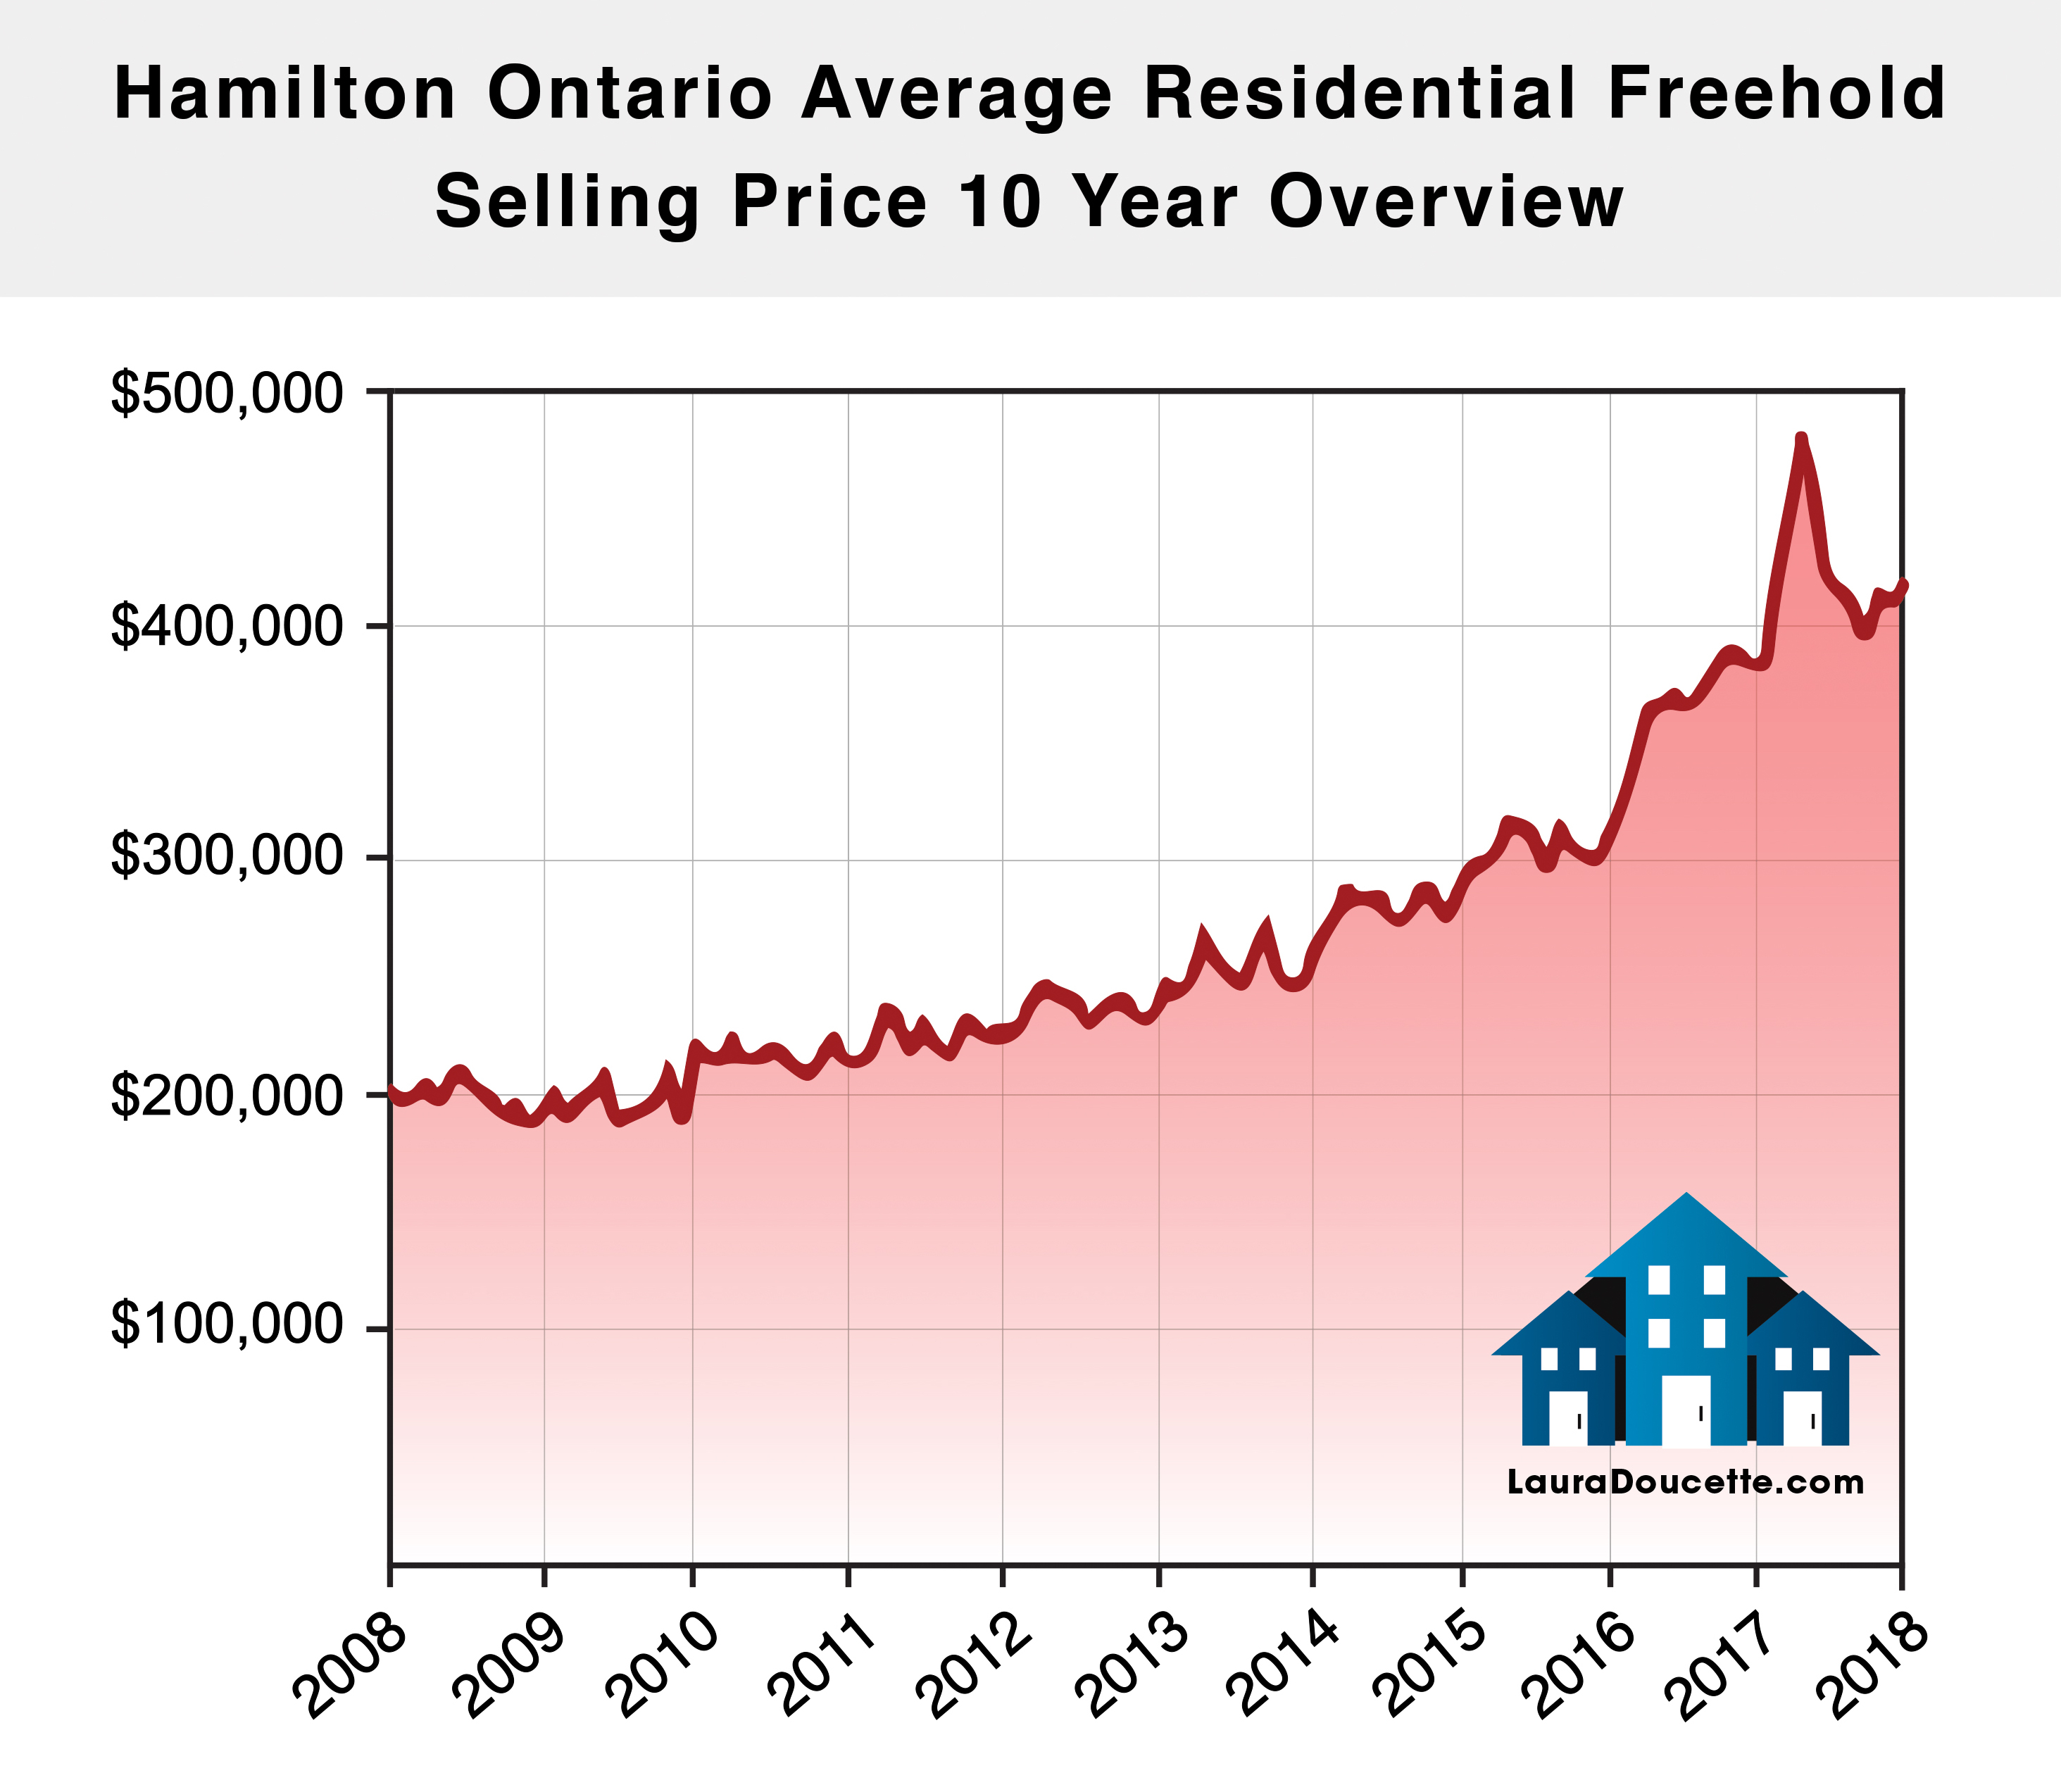
“Rollercoaster” is the word most used in describing the Real Estate Market in and around Hamilton Ontario in 2017. The Spring Market set record highs for prices, multiple offers, and sales. The low inventory was a major factor. High Demand + Low Supply/Inventory = HIGH $ resulting in record high selling prices. As more people saw the prices that homes on their street were selling for, there was an influx of inventory in the late spring and summer.
Contrary to popular belief, the shift in the market in 2017 stemmed primarily from the shift in available properties for sale (and not the Provincial Government’s introduction of the Housing Measures which included the 15% tax on foreign homebuyers). Low Inventory was the constant factor that kept prices increasing. As Supply increased, prices started coming down, and quite quickly.
By summer, many buyers had already bought or had been discouraged by their experience in the spring. Low Demand + High Supply/Inventory = Lower $ resulting in a decrease in average selling prices. Things started to level off in the fall, and there were many signs of a Balanced Market. Late fall the Government introduced yet another blow called a Stress Test, which went into effect January 1, 2018. Now, all mortgages, not just high ratio mortgages will be affected and it will have a net effect of reducing the buying power of many homebuyers by up to 20%.
For example: If you qualified for a $400,000 Mortgage in December 2017, you may now only qualify for $320,000. So yes, 2017 was full of ups and downs in the Real Estate Market.

VS

For more information and an overview of the average selling prices for some of the Hamilton Districts and Suburbs of Hamilton Ontario Canada compared to 5 years ago (2012) and 10 Years ago (2007). Click HERE

