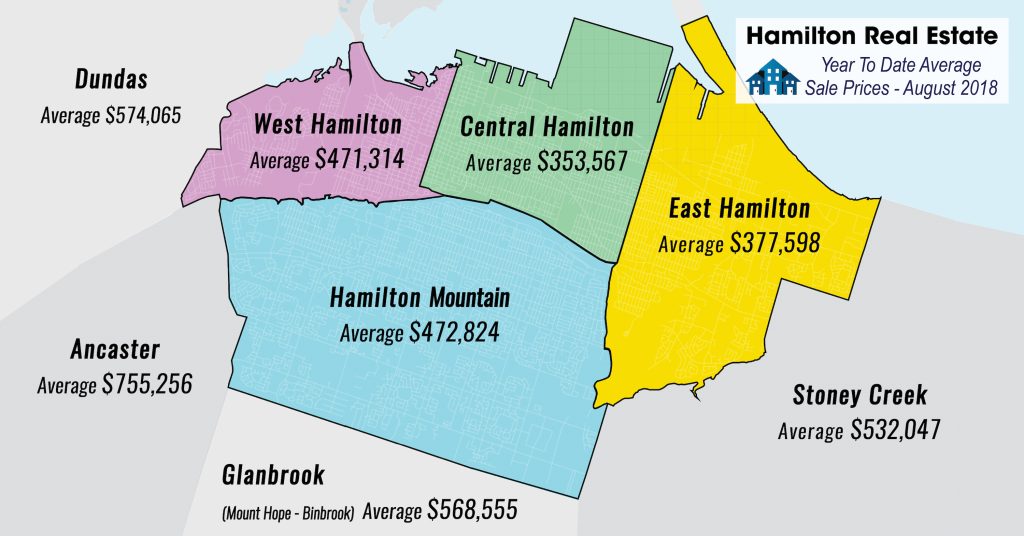
Hamilton Real Estate Sold Statistics for August 2018
August 2018 showed 1882 New Listings come on the Hamilton Real Estate Market from ALL Property Types (1603 From Residential Only). This is only 0.5% LOWER than August 2017 (3.0% lower for Residential and 4.5% LOWER than the 10-year average), as reported by The REALTORS ® Association of Hamilton-Burlington (RAHB).
All Residential Only Sales of 1089 Properties were only down by 0.6% from the same month last year. RAHB CEO George O’Neil stated “August was the first month this year that sales were closer to the 10-year average…In fact, if you remove the two record-setting months of August in 2015 and 2016, sales were in line with the 10-year average.” The Average Residential Sales Price of properties sold through the RAHB Multiple Listing Service® (MLS) system in August 2018 was $540,891 compared to $554,173 the same month last year, a slight decrease of 2.4%. That is broken down between Residential Freehold Average Price of $565,039 (down 3.8% from $587,545 in August 2017) and the Condominium Average Price at $440,997 (up quite a bit from $412,101 in August 2017). The end of month listing inventory shows 2475 Freehold Residential Properties left for sale, up 3.6% compared to 2389 Properties still available for sale at the end of August last year. Average days on the market increased from 33 to 37 for Freehold in August this year, and from 29 to 38 for Condominiums.
The Hamilton – Burlington Areas shows a shifting towards a Seller Market, where the ratio of Homes Sold to Homes Listed is above 60%, currently sitting at 68% for Residential, (in other words 6.8 homes are sold for every 10 new listings). Homes Sold to Homes Listed Ratio: Buyers Market is below 40%, Balanced Market is between 40-60%, and Sellers Market is above 60%. Here is a comparison looking back over the last 3 years at what the market looked like in August which is usually one of the slowest months for Residential Freehold Homes.
Average Residential Freehold Price Sales-to-new-listing ratio Type of Market
August 2016 $496,157 85.8% Sellers Market
August 2017 $553,984 66.3% Sellers Market
August 2018 $540,891 68.0% Sellers Market
Click Here to continue the in-depth look at Hamilton Real Estate Statistics for August 2018


