
April 2025 Real Estate Sold Statistics
Residential Real Estate Market Report April 2025
The Hamilton Real Estate Market in April 2025 marked the highest inventory level for the month of April since 2009, with months of supply at 4 months. Housing activity is still being impacted by the continued uncertainty about tariffs. With sales in the Hamilton, Burlington and surrounding areas slowing to 805 units. This is a 26% decline in sales compared to April 2024 and a 46% decrease below typical numbers reported for April. With the increase in inventory and the decrease in sales, we are now in a Buyer’s Market where the sales-to-new listings ratio drops under 40%, now sitting at 39%.
The overall year-to-date Average Residential Price (including all property types throughout the Hamilton-Burlington areas) decreased by 3.1% since this time last year, to $847,869. (For specific area average prices, please see chart below).
April 2025 had 2,043 Total Residential Listings come through the Hamilton Real Estate Board. Hamilton had 1,287 of those, up 1.7% from April 2024, and Burlington’s share was 405, down 13.1% from the same month last year.
The overall average price for residential properties decreased this month from last month ($876,520) to $861,196. Hamilton’s Residential Sales (including Flamborough, Dundas, Ancaster, Waterdown, Stoney Creek and Glanbrook) were 511, down 20.4% from April 2024, with an average price of $791,384, down 3.2% from the same month last year, however, slightly up from last month, which was $788,968. Burlington had 152 Sales, which is down 46.1% from last year, with an average price of $1,178,724, which is up 2.4% from April 2024, however, down from last month’s average of $1,194,928. For ALL Year-To-Date Average Prices, please see the charts below.
The end-of-month listing inventory, which is a good indication of the type of market currently being experienced now sits at 2,126 Active Residential Listings up 36.5% over April 2024, giving Hamilton 4.16 months of supply compared to 4.25 months’ supply last month. Burlington has 619 Active Residential Listings up 40.4% over the same month last year, giving it 4.07 months of supply compared to 3.31 last month. Overall, the number of Active Listings Available in the entire area covered by The Hamilton Burlington Real Estate Board (now part of Cornerstone) at the end of the month now sits at 3,333 properties for sale, which is 4.14 months supply, compared to 2,567 and 2.36 months of supply one year ago in April 2024, and 2,913 properties for sale with 4.16 months of supply last month in March 2025. The average days on the market is up from this month last year, sitting at 33, however, down slightly from last month (34 days), to sell a home in Hamilton. In Burlington, it is also up from last yea,r sitting at 25, which stayed the same as last month.
As stated above, the Hamilton-Burlington Area is now experiencing a the Buyer’s Market Status, where the ratio of Homes Sold to Homes Listed falls below 40%, currently sitting at the 39% (4 homes sold for every 10 listed).
Buyers MarketBelow 40% |
Balanced MarketBetween 40% and 60% |
Sellers MarketAbove 60% |
|---|---|---|
|
(Ratio of Homes Sold to Homes Listed)
|
||
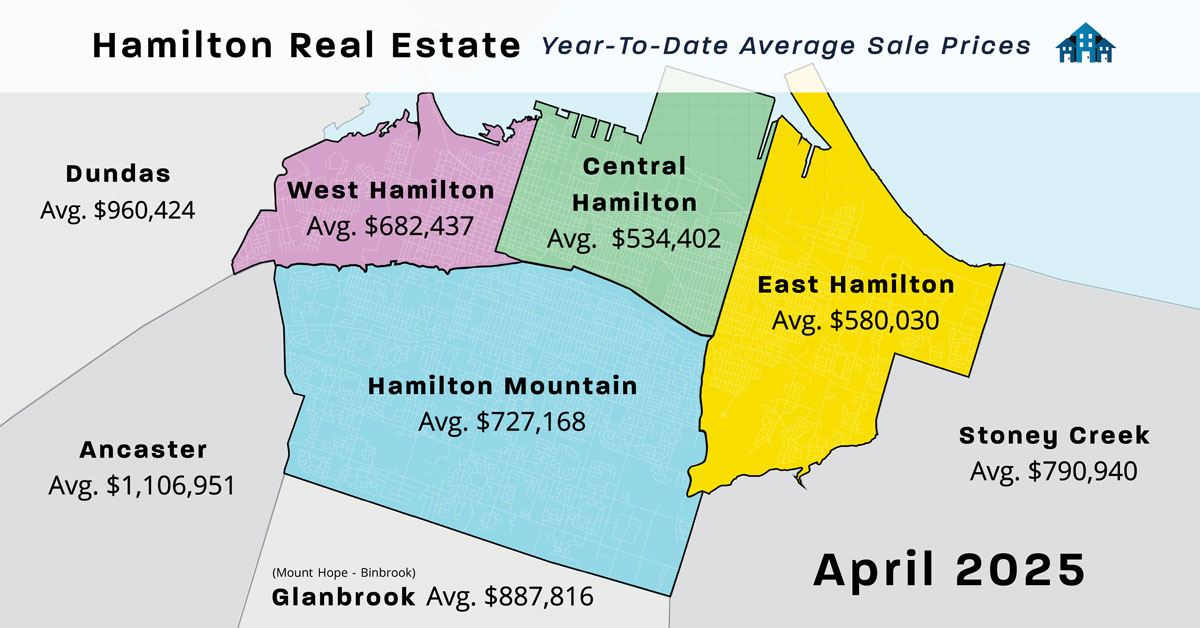
Year-to-date Average Prices For Hamilton
The map below shows the current Year-To-Date Average Residential Prices. When looking at the Average Prices in and around Hamilton, it is important to note how they have changed significantly over the last year and even now from month to month. If you are thinking of selling your house or condominium, get the most up-to-date. Here are a few other areas that are not listed on the map below.
Burlington – $1,143,453 – Up
Flamborough – $1,210,967 – Down
Waterdown – $1,012,205 – Down
Grimsby – $846,817 – Up
Caledonia – $757,836 – Down
Cayuga – $843,700 – Up
Dunnville – $613,797 – Up
Note that the “Average Sale Price” is based on the total dollar volume of all properties sold through the RAHB MLS® System. Average sale price can be useful in establishing long-term trends, but should not be used as an indicator that specific properties have increased or decreased in value.” What that means is, that not every house or condo has increased in price by the same percentage. It is really important to talk to an experienced local REALTOR® to see EXACTLY what is happening in your particular neighbourhood. It is also important to find out what you can do to your house to get the highest amount possible when you are ready to sell!
In this Market, it is important that you know about the houses getting listed immediately! Click Here to get set up on the Instant Listings Notification Search, otherwise, you will only know about listings once they are reported to the public sites. If you wait till you see it on Realtor.ca or other sites, it’s too late, and is probably already SOLD!
MLS® Property Listings April 2025
RAHB Market Activity |
Number of Sales April 2025 |
Number of Sales April 2024 |
Average Sale Prices in April 2025 |
Average Sale Price April 2024 |
|
West Hamilton
|
35
|
48
|
$732,161
|
$767,328
|
|
East Hamilton
|
59 | 61 |
$577,022
|
$631,723
|
|
Central Hamilton
|
59 | 71 |
$571,854
|
$569,773
|
|
Hamilton Mountain
|
127 | 142 |
$687,086
|
$772,599
|
|
Flamborough
|
18 | 20 |
$1,196,814
|
$1,345,375
|
|
Dundas
|
37 | 25 |
$985,046
|
$1,035,374
|
|
Ancaster
|
35 | 57 |
$1,335,933
|
$1,080,750
|
|
Waterdown
|
30 | 41 |
$1,010,377
|
$1,079,437
|
|
Stoney Creek
|
78 | 94 |
$790,065
|
$791,817
|
|
Glanbrook
|
32 | 52 |
$840,838
|
$796,518
|
|
Burlington
|
152 | 271 |
$1,178,724
|
$1,152,357
|
|
Dunnville
|
15 | 19 |
$699,172
|
$694,416
|
|
Cayuga
|
7 | 7 |
$849,143
|
$921,429
|
|
Caledonia
|
16 | 16 |
$722,956
|
$760,416
|
|
Hagersville
|
10 | 11 |
$587.600
|
$737,682
|
|
Seneca
|
1 | 1 |
$810,000
|
$1,155,000
|
|
Rainham
|
5 | 3 |
$688,800
|
$620,000
|
|
Grimsby
|
26 | 43 |
$917,799
|
$813,337
|
|
West Lincoln
|
21 | 11 |
$900,381
|
$798,364
|
Note: Numbers of sales represent sales reports on properties listed on the Multiple Listing Service (MLS®) of the REALTORS® Association of Hamilton-Burlington. The average price is calculated by dividing the total dollar volume of sales (not shown) by the number of sales in that month.
