
January 2019 Real Estate Sold Statistics Hamilton
Statistics, House And Condo Values, MLS Properties For Sale
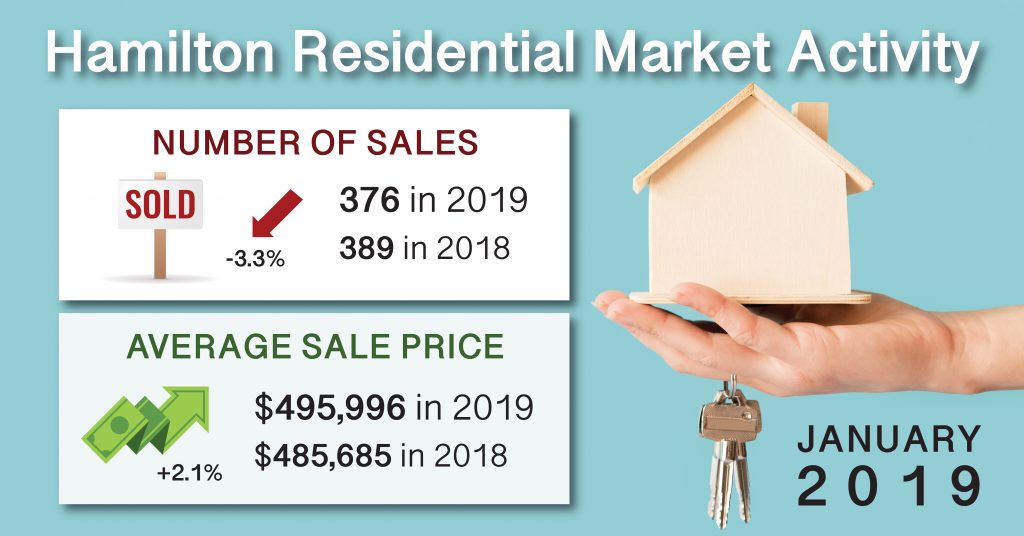
Hamilton Ont. Real Estate Market Update Report For January 2019
January 2019 had over 58 cm of snow and still showed 809 New Residential MLS Listings came through the Hamilton Real Estate Board. This is 22% HIGHER than January 2018 as reported by The REALTORS ® Association of Hamilton-Burlington (RAHB). Burlington is UP 24% with 322 New Listings.
Residential Sales located throughout the RAHB market area (including Burlington and all outlying areas covered by RAHB) of 593 Properties were down slightly, just 3.6% from the same month last year. Residential Sales in Hamilton (which includes Hamilton plus Flamborough, Dundas, Ancaster, Waterdown, Stoney Creek and Glanbrook) were 376 of that total. The Average Hamilton Residential Sales Price of properties sold through the RAHB Multiple Listing Service® (MLS) system inJanuary 2019 was $495,996 up 2% from $485,658 the same month last year. Burlington is up 5% to $712,040. The end of month listing inventory shows 1139 Active Residential Listings, giving Hamilton 3 months of inventory, which is up slightly, 0.9% compared to 827 Properties still available for sale at the end of January last year which was 2.1 months of inventory. Burlington has 2.6 months of inventory (up just 0.5%) with 368 active listings for sale. Average days on the market increased from 33 to 36 this year for Hamilton and increased in Burlington from 35.1 to 36.3
The Hamilton – Burlington Areas presently sitting in a Balanced Market, where the ratio of Homes Sold to Homes Listed is between 40% and 60%, currently sitting at 46.7% for Residential, (in other words, just under 5 homes are sold for every 10 new listings). Homes Sold to Homes Listed Ratio: Buyers Market is below 40%, Balanced Market is between 40-60%, and Sellers Market is above 60%.
For the rest of the article click here
