
August 2017 Sold Real Estate Market Statistics Hamilton
Hamilton Real Estate August 2017 Market Report
August 2017 reported 1,748 New Listings, up 5.4% from August 2016, and 4.2% higher than the 10-year average. Residential Sales were down by 18.2% from August last year and Condominium Sales were 12.3% lower.
The Average Residential Freehold Sales Price of properties sold through the RAHB Multiple Listing Service® (MLS) system in August 2017 was $553,984 compared to $496,157 the same month last year, an increase of 11.7%, and the Condominium Average Price is $412,308 compared to $359,762, which is up 14.6% from last year in this month.
Trending NOW…Is Real Estate still Sellers Market in around Hamilton Ontario?
The data provided by the Hamilton-Burlington Real Estate Board shows that we are still trending towards more of a Balanced Market from the total Sellers Market we experienced throughout the Spring of 2017. We are not there yet though. The Sales to new listings ratio is at just over 65%, which is at the low end of a Sellers Market. The end of month listing inventory supports this with 2166 Freehold Residential Properties for left for sale, up 56.1% compared to 1388 left at the end of August 2016. Also, Average days on the market increased from 27 to 33 for freehold this month!
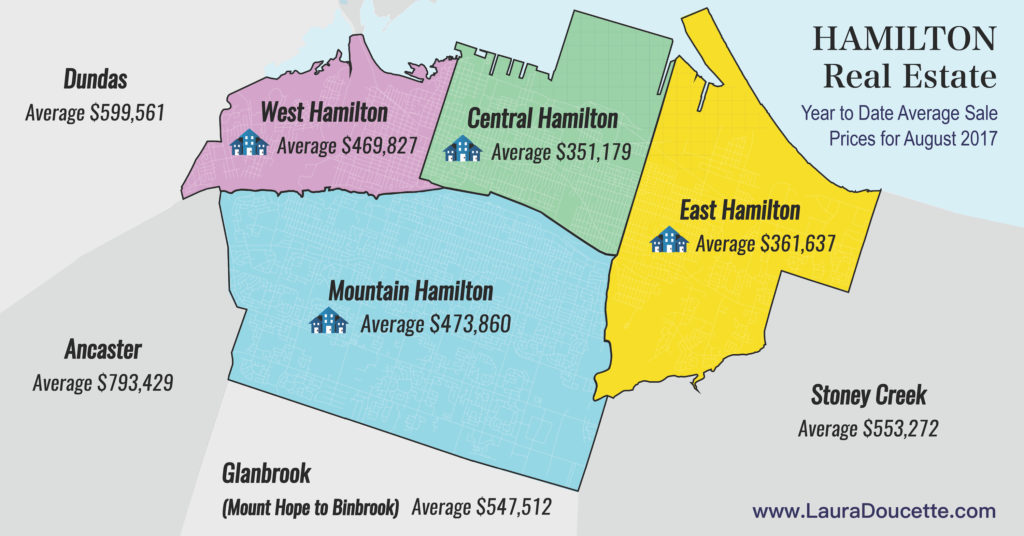
The map below shows the current Year to Date Average Prices. Most Prices listed are lower than they were last month, showing the trend to a more Balanced Housing Market, making it a little easier on Buyers looking to get into their first home.
Some of the areas not included in the map below are Burlington which dropped from$779,342 to $770,657, Flamborough decreased from $802,787 to $789,761, Waterdown decreased from $692,324 to $689,701, Grimsby showed a decrease to $595,306 from $598,892 last month, Smithville dropped from $483,678 to $476,229 this month, and Cayuga dipped from an average selling price year to date of $417,881 to $411,876.
When looking at the Average Prices in and around Hamilton, it is important to note how they have changed significantly over the last year and even now from month to month. If you are thinking of selling your house or condominium, get the most up to date, LOCAL information. A Market Evaluation done even a few months ago needs to be updated!
Always remember that “Average sale price is based on the total dollar volume of all properties sold through the RAHB MLS® System. Average sale price can be useful in establishing long term trends, but should not be used as an indicator that specific properties have increased or decreased in value.” What that means is not every house or condo has increased in price by the same percentage. It is really important to talk to an experienced local REALTOR® to see EXACTLY what is happening in your particular neighbourhood. It is also important to find out what you can do to your house to get the highest amount possible when you are ready to sell!
In this Market, it is important that you know about the houses getting listed Immediately! Click Here to get set up on the Instant Notification Search, otherwise, you will only know about listings once they are reported to the public sites. If you wait till you see it on Realtor.ca or other sites, it’s too late, and is probably already SOLD!
For More info on Real Estate Statistics – Click Here!
