Hamilton Real Estate July 2017 Market Report
July 2017 set another Listings record! All Property Type New Listings were 2,013 which is an increase of 17.8% from July 2016 and 9.2% higher than the 10-year average, and the most Listings ever in the month of July! Residential Listings were up 18.8% 1,878, Freehold Listings up 19.3% 1,574, and Condominium Listings went up 16% to 304.
Sales, on the other hand, were down by over 20% in each of these categories for the month of July. Residential Sales dropped 21.4% to 1125. Increased Listings and Decreased Sales led to a drop, even though slightly in some areas, in the Average Sales Prices. The Average Residential Freehold Sales Price of properties sold through the RAHB Multiple Listing Service® (MLS) system in July 2017 was $571,598 compared to $523,382 the same month last year, an increase of only 9.2%, and the Condominium Average Price is $413,558 compared to $343,211, which is up 20.5% from last year in this month.
Trending NOW…Is Real Estate still a Sellers Market in an around Hamilton Ontario?
The data provided by the Hamilton-Burlington Real Estate Board suggests that we have turned from a Sellers Market to a more moderate, Balanced Market. The end of month listing inventory would support this theory. Up 53.6%, with 2301 Freehold Residential Properties left for sale compared to 1498 left at the end of July 2016. Also, Average days on the market increased from 24 to 25 for freehold! It still decreased, however, from 27 to 25 in the condo market compared to the same month last year. List-To-Sell ratios reached a high of 91% earlier this year and have dropped considerably to a 60% list-to-sell ratio, showing the pattern going from a Sellers Market to a Balanced Market in recent months.
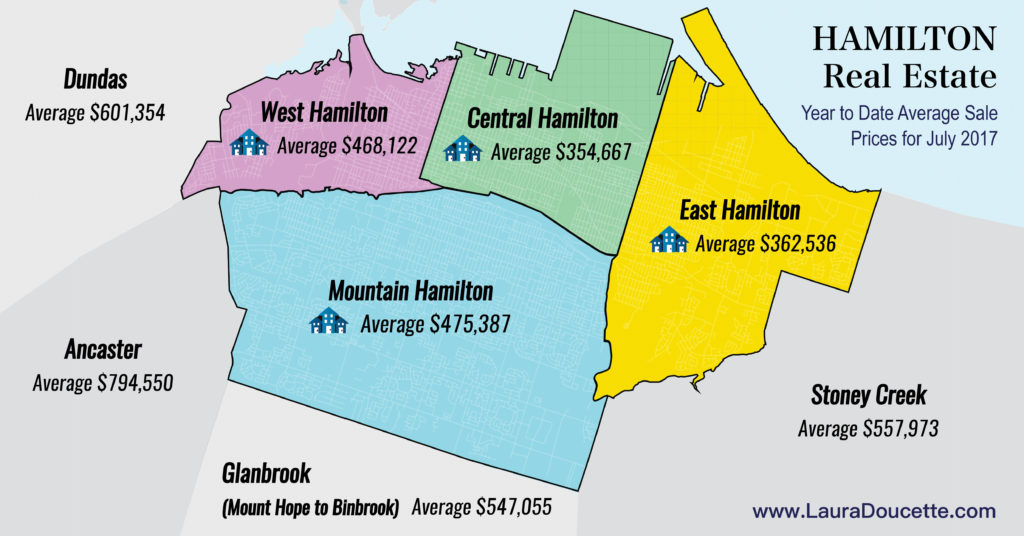
The map below shows the current Year to Date Average Prices. In every area, the average prices actually went lower, showing the effect of the rise in Inventory and Decrease number of Sales!
Some of the areas not included in the map below are Burlington that decreased ever so slightly from $789,564 to $789,485, Flamborough has decreased slightly from $803,624 last month to $802,787, Waterdown decreased from $694,792 to $692,324, Grimsby also showed a decrease to $598,892 from $599,797 last month.
When looking at the Average Prices in and around Hamilton, it is important to note how they have changed significantly over the last year and even now from month to month. If you are thinking of selling your house or condominium, get the most up to date, LOCAL information. A Market Evaluation done even a few months ago needs to be updated! Here is a map showing the Current Average Year To Date Prices in and around Hamilton Ontario…

Always remember that “Average sale price is based on the total dollar volume of all properties sold through the RAHB MLS® System. Average sale price can be useful in establishing long term trends, but should not be used as an indicator that specific properties have increased or decreased in value.” What that means is not every house or condo has increased in price by the same percentage. It is really important to talk to an experienced local REALTOR® to see EXACTLY what is happening in your particular neighbourhood. It is also important to find out what you can do to your house to get the highest amount possible when you are ready to sell!
In this Market, it is important that you know about the houses getting listed Immediately! Click Here to get set up on the Instant Notification Search, otherwise, you will only know about listings once they are reported to the public sites. If you wait till you see it on Realtor.ca or other sites, it’s too late, and is probably already SOLD!

