
March 2026 Hamilton Real Estate Statistics
Residential Real Estate Statistics | Hamilton, Burlington & Area
Live Market Activity – March 2026
The chart below illustrates the year-to-date average residential sale price across the Hamilton-Burlington region, with side-by-side comparisons to the two previous years. Viewing current pricing trends against recent historical performance helps identify whether values are strengthening, stabilizing, or adjusting as the market moves through 2026.
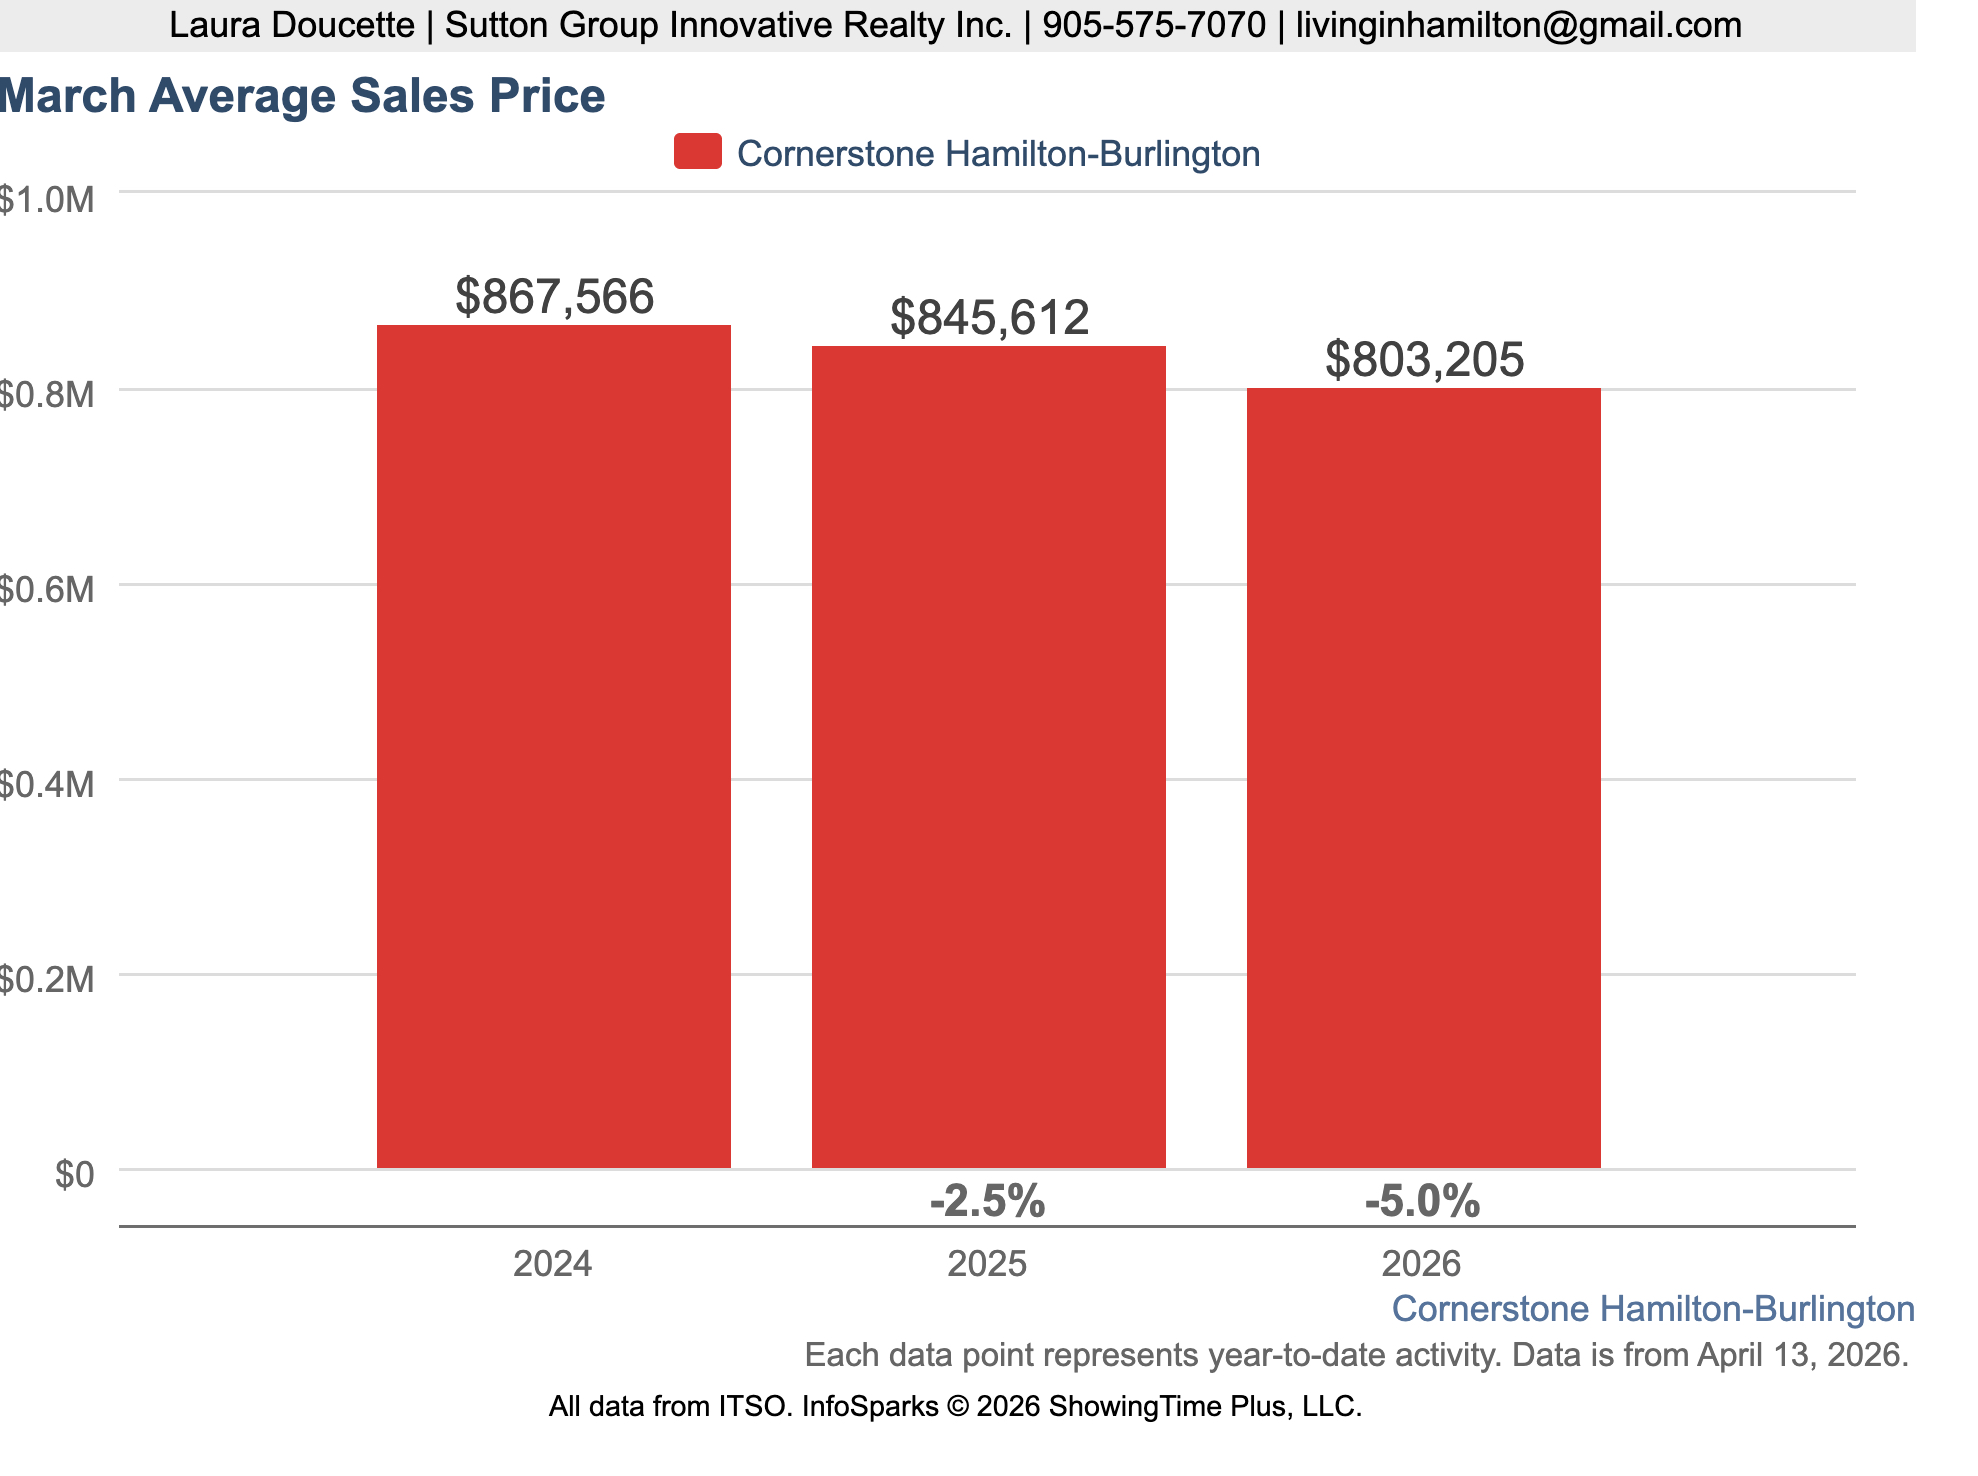
Source: ITSO / Showing Time – Live MLS Market Activity
Year-To-Date Residential Prices – March 2026
With the first quarter of the year now complete, these figures reflect combined market activity for January and March.
Hamilton
$723,517
Burlington
$1,075,019
Average price statistics provide a useful indicator of overall market direction. However, pricing performance can vary significantly by neighbourhood, property type, and price range, which is why local market analysis remains important when evaluating a specific property.
Market Overview – March 2026
March brought the expected spring pickup in activity, with both sales and new listings increasing sharply over February. This is the point in the year where the market starts to move, and 2026 is following that pattern. That said, the bigger story is not the month-over-month improvement. It is the year-over-year comparison.
Sales remain slightly lower than last March, prices are still down, and buyers continue to be more selective.
Inventory has increased compared to February, giving buyers more choice and more time to make decisions. At the same time, homes that are priced correctly are still selling, often without sitting long.
This is a balanced market on paper, but in practice, it’s a very price-sensitive and unforgiving when homes are not positioned correctly.
Sales Activity
A total of 721 residential properties sold across the Hamilton-Burlington region in March.
- Up from 529 sales reported for March
- Down 2.6 percent compared to March 2025
By Area
- Hamilton: 451 sales (down 3.4% year-over-year)
- Burlington: 172 sales (up 1.8% year-over-year)
Pricing Trends
The average residential sale price in March was $810,232, down from $882,058 in March 2025.
Hamilton $721,075 (down 8.7% year-over-year)
Burlington: $1,066,134 (down 10.3% year over year)
While short-term price movements can fluctuate from month to month, average sale price remains best viewed as a broader trend indicator. The current trend continues to reflect price adjustments compared to last year, with variation depending on location and property type.
New Listings
There were 1,676 new residential listings added in March.
-
Up from 1,195 listings in February
-
Down 8.7% compared to March 2025
By Area
- Hamilton: 1,078 new listings (down 7.8% year-over-year)
- Burlington: 351 new listings (down 9.8% year-over-year)
The increase in new listings compared to February is typical for the spring season and is contributing to improved selection for buyers.
Inventory and Months of Supply
Inventory increased compared to February but remains below last year’s levels. Months of supply reached 3.9 months across the region.
Local Supply Conditions
- Hamilton: 4.0 months of supply
- Burlington: 3.2 months of supply
These levels continue to support balanced conditions, with neither buyers nor sellers holding a clear advantage across the overall market.
Days On Market
Homes are currently taking an average of 39 days to sell, compared to 47 days in February
- Hamilton: 45 days on average (up 28.6% year-over-year)
- Burlington: 39 days on average (up 56.0% year-over-year)
While homes are selling faster than last month, they are still taking longer compared to last year, reflecting more choice and more cautious buyers.
Market Definitions (Sales-to-New-Listings Ratio)
- Buyers Market: Below 40%
- Balanced Market: 40% – 60%
- Seller’s Market: Above 60%
March 2026 SNLR: 43%, placing the market within Balanced Market conditions.
Property Type Insights
Recent trends continue to show variation across property types and price ranges. Buyers have more flexibility than in recent years, particularly in segments where inventory has increased. At the same time, well-priced homes in desirable areas are still attracting attention and selling within reasonable timeframes.
March 2026 Residential Sales & Average Prices By Area
RAHB Market Activity |
Number of Sales Mar 2026 |
Number of Sales Mar 2025 |
Average Sale Prices in Mar 2026 |
Average Sale Price Mar 2025 |
|
West Hamilton
|
36
|
27
|
$635,584
|
$748,724
|
|
East Hamilton
|
48
|
59 |
$548,853
|
$585,827
|
|
Central Hamilton
|
56
|
47 |
$492,302
|
$526,060
|
|
Hamilton Mountain
|
120
|
117 |
$678,432
|
$719,532
|
|
Flamborough
|
11
|
16 |
$1,438,659
|
$1,144,469
|
|
Dundas
|
22
|
31 |
$876,086
|
$966,584
|
|
Ancaster
|
34
|
39
|
$1,068,466
|
$1,180,933
|
|
Waterdown
|
30
|
26
|
$819,043
|
$938,688
|
|
Stoney Creek
|
60
|
74 |
$755,267
|
$787,927
|
|
Glanbrook
|
37
|
33 |
$742,407
|
$911,771
|
|
Burlington
|
174
|
159 |
$1,062,116
|
$1,188,484
|
|
Dunnville
|
8
|
13 |
$603,513
|
$619,308
|
|
Cayuga
|
6
|
7 |
$910,167
|
$977,857
|
|
Caledonia
|
20
|
11 |
$706,625
|
$798,618
|
|
Hagersville
|
6 | 6 | $630,833 |
$496,667
|
|
Grimsby
|
28
|
32 |
$831,670
|
$859,563
|
|
West Lincoln
|
8
|
7 |
$702,188
|
$830,714
|
Note: Numbers of sales represent sales reports on properties listed on the Multiple Listing Service (MLS®) of the REALTORS® Association of Hamilton-Burlington. The average price is calculated by dividing the total dollar volume of sales (not shown) by the number of sales in that month.
Year-To-Date Market Context
With the first quarter of 2026 now complete, the data continues to show:
Sales improving compared to the slower winter months.
Inventory levels supporting balanced conditions
Price adjusting compared to last year’s peak levels
More choice for buyers compared to early 2025
Local Market Observations
March marks the start of the spring real estate cycle, and this year is no exception. Activity has picked up, listings have increased, and homes are selling faster than they were just a month ago. At this same time, buyers remain cautious and value-focused, which continues to influence pricing and negotiation. This is a market that rewards preparation, realistic pricing, and a clear strategy on both sides.
Want a Closer Look?
Request a neighbourhood-specific market analysis
Get set up on instant listing notifications so you see new homes the moment they hit the market
Explore Hamilton Real Estate Trends
Hamilton Real Estate Price History Since 1990
Monthly Market Updates
Annual Market Reviews
For long-term Hamilton price trends since 1990, see our full market history report here.
Disclaimer: The statistics provided are based on information from the ITSO MLS® System, of which Cornerstone is a proud founding member. Multiple MLS® Systems operate within Ontario, and while none can be guaranteed to include every property listed or sold within a given area, they effectively illustrate market trends. Cornerstone cautions that these statistics can help identify long-term trends but should not indicate that specific properties have increased or decreased in value. Those requiring specific information on property values should contact a REALTOR®. REALTORS® have their fingers on the pulse of the market and have access to more comprehensive tools and analytics. They know the questions to ask, the areas to probe and what to look for to get a complete picture of the property and community you’re considering.
