
February 2026 Hamilton Real Estate Statistics
Residential Real Estate Statistics | Hamilton, Burlington & Area
Live Market Activity – February 2026
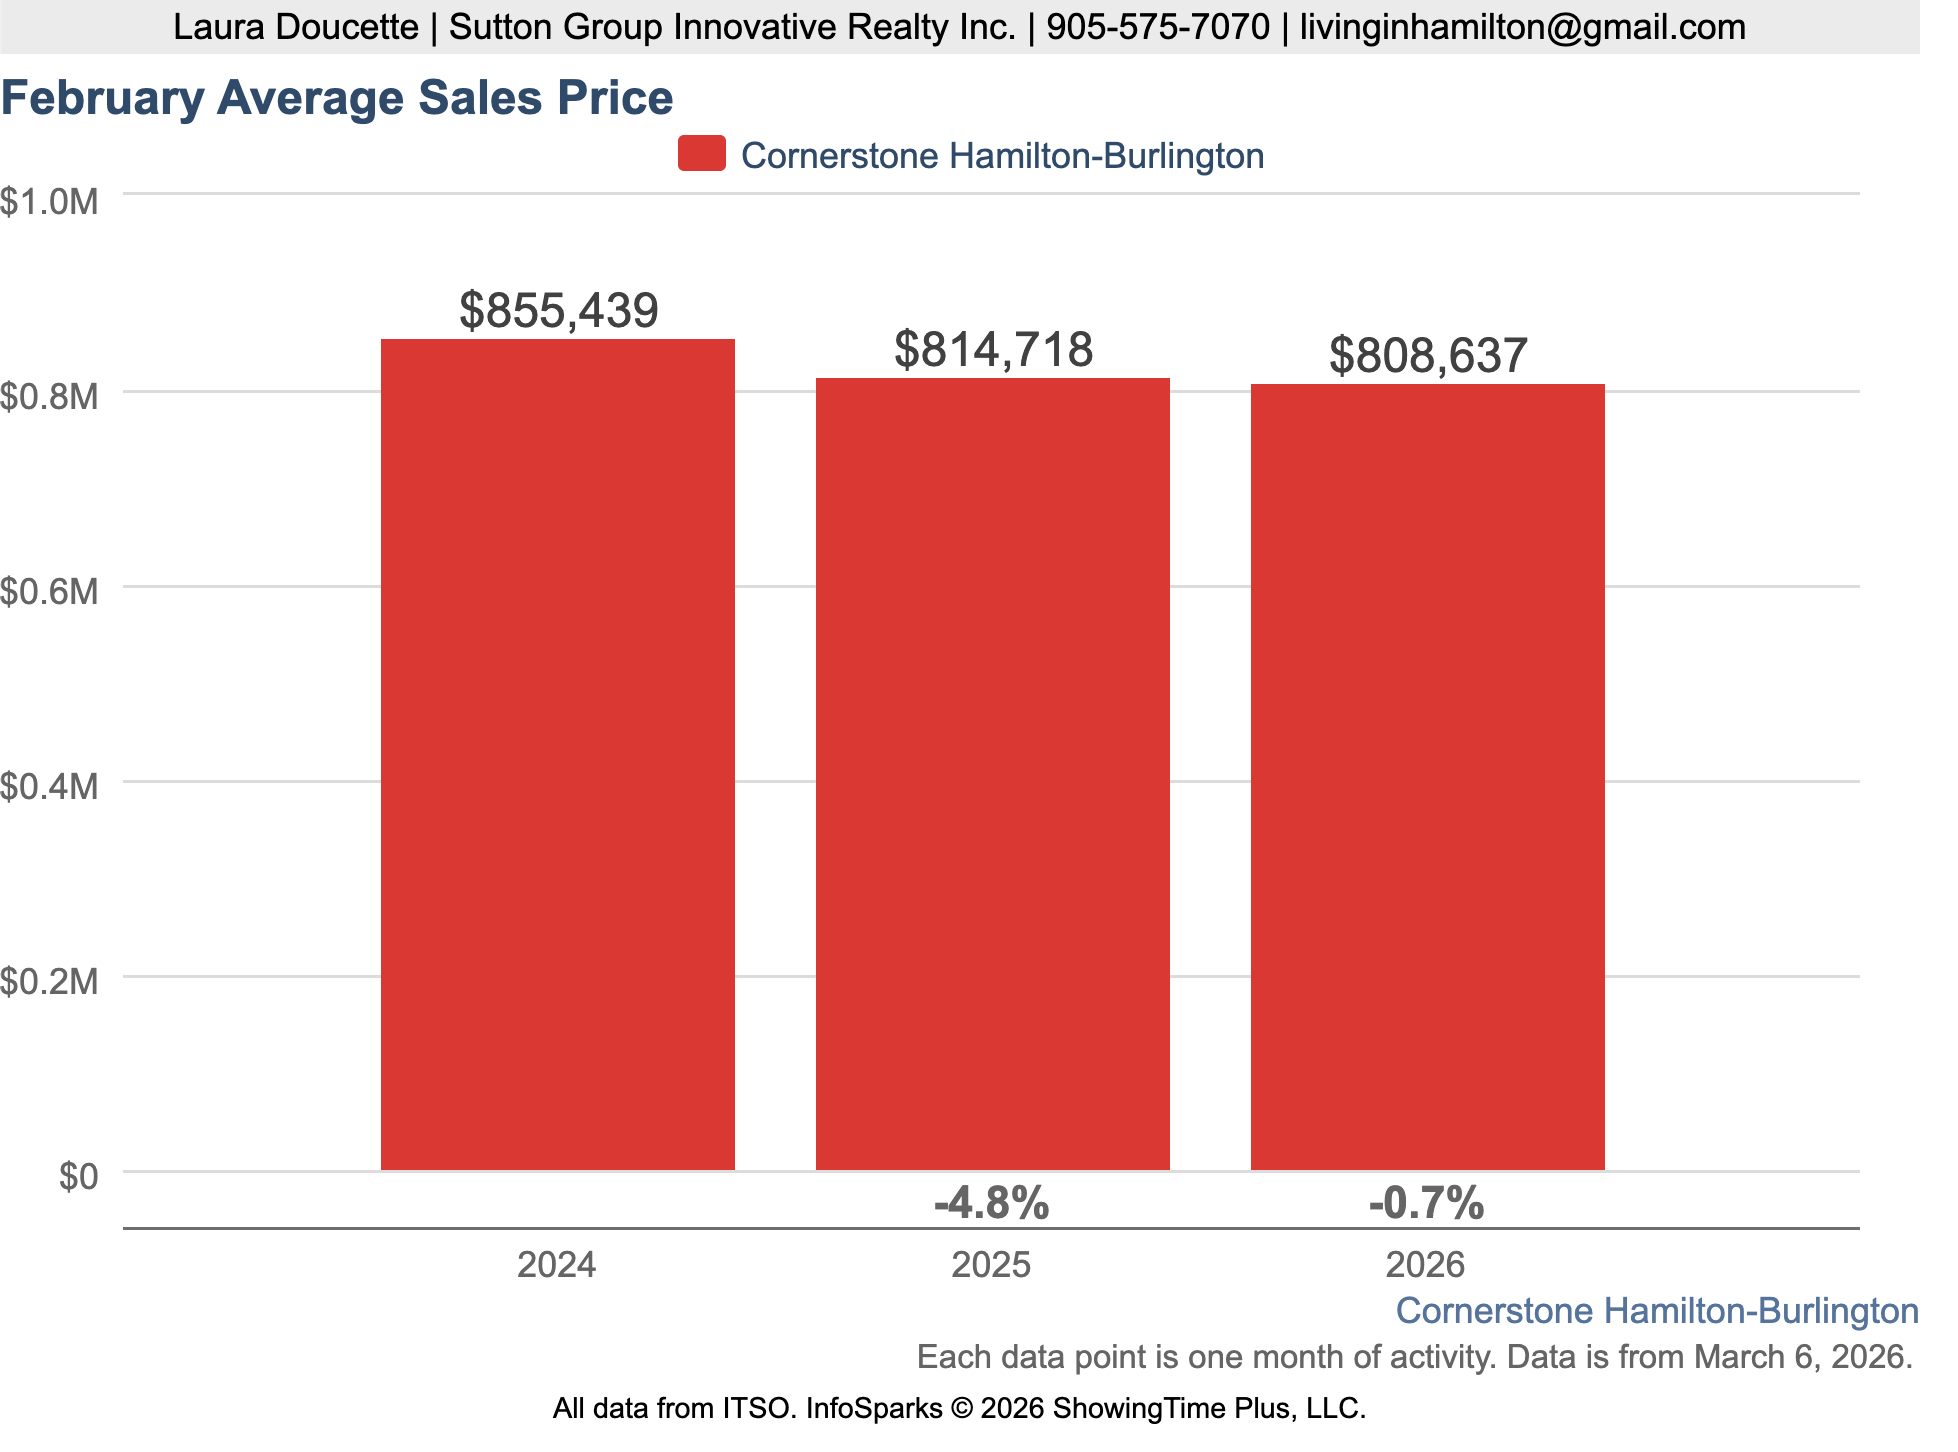
The chart below illustrates the year-to-date average residential sale price across the Hamilton-Burlington region, with side-by-side comparisons to the two previous years. Viewing current pricing trends against recent historical performance helps identify whether values are strengthening, stabilizing, or adjusting as the market moves through 2026.
Source: ITSO / Showing Time – Live MLS Market Activity
Year-To-Date Residential Prices – February 2026
With the first two months of the year now complete, these figures reflect combined market activity for January and February.
Hamilton
$727,384
Burlington
$1,060,951
Average price statistics provide a useful indicator of overall market direction. However, pricing performance can vary significantly by neighbourhood, property type, and price range, which is why local market analysis remains important when evaluating a specific property.
Market Overview – February 2026
The Hamilton-Burlington residential real estate market moved into Balanced Market territory in February, as sales activity improved compared to January, while inventory levels remained elevated compared to the same period last year.
A total of 525 residential homes sold across the region during the month. This represents an increase from January but remains 12.6 percent lower than February 2025.
While inventory remains higher than last year, the increase in sales helped narrow the gap between supply and demand.
As the spring market approaches, both new listing activity and buyer confidence will be important factors in determining how the market continues to evolve through the remainder of the year.
Sales Activity
A total of 525 residential properties sold across the Hamilton-Burlington region in February.
- Up from 471 sales reported for January
- Down 12.6 percent compared to February 2025 (601 Sales)
By Area
- Hamilton: 337 sales (down 16.4% year-over-year)
- Burlington: 118 sales (up 4.4% year-over-year)
Pricing Trends
The average residential sale price in February was $808,637, up from $786,990 in January but slightly lower than $814,718 in February 2025.
This represents a 2.8% increase month-over-month and a 0.7% decrease year-over-year.
While short-term price movements can fluctuate from month to month, average sale price remains best viewed as a broader trend indicator. Price performance continues to vary significantly depending on neighbourhood, property type, and price range.
New Listings
There were 1,188 new residential listings added to the market in February.
-
Compared to January: 1,207 listings
-
Compared to February 2025: down 17.4% (1,439 listings)
By Area
- Hamilton: 760 new listings
- Burlington: 253 new listings
While new listings declined slightly compared to January, inventory levels remain higher than last year, continuing to provide buyers with more choice as the market moves toward the spring season.
New listing activity continues to play an important role in shaping market balance as buyers respond to changing inventory levels.
Inventory and Months of Supply
Active inventory across the region ended February at 2,501 listings (2,339 in January) and was up 1.6% year-over-year. This translated into 3.4 months of supply, up from 3.2 months in January and up 13% compared to February 2025.
Local Supply Conditions
- Hamilton: 3.6 months of supply
- Burlington: 2.9 months of supply
Rising inventory levels and increased months of supply continue to support more balanced market conditions, giving buyers additional choice compared to the tighter supply seen in recent years.
Days On Market
Homes are currently taking an average of 51 days to sell, compared to 57 days in January and 37 days during the same period last year.
- Hamilton: 51 days on average (56 in January, 39 last year)
- Burlington: 50 days on average (51 in January, 23 last year)
Longer marketing times compared to last year reflect the increased inventory and more balanced conditions now present in the Hamilton-Burlington real estate market.
Market Definitions (Sales-to-New-Listings Ratio)
- Buyers Market: Below 40%
- Balanced Market: 40% – 60%
- Seller’s Market: Above 60%
February 2026 SNLR: 44%, placing the market within Balanced Market conditions.
Property Type Insights
Recent data also shows differences between property types across the region. In Burlington, median prices for single-family homes increased slightly year-over-year while townhouse and condominium prices remained relatively stable. In Hamilton, median prices declined modestly across both property types while days on market increased.
These trends suggest that buyers currently have more negotiating flexibility than in recent years, particularly in segments where inventory levels have increased.
February 2026 Residential Sales & Average Prices By Area
RAHB Market Activity |
Number of Sales Feb 2026 |
Number of Sales Feb 2025 |
Average Sale Prices in Feb 2026 |
Average Sale Price Feb 2025 |
|
West Hamilton
|
34
|
32
|
$664,674
|
$649,870
|
|
East Hamilton
|
27
|
59 |
$579,453
|
$602,577
|
|
Central Hamilton
|
44
|
63 |
$495,057
|
$540,742
|
|
Hamilton Mountain
|
93
|
93 |
$656,161
|
$739,222
|
|
Flamborough
|
10
|
8 |
$1,385,650
|
$1,581,252
|
|
Dundas
|
16
|
22 |
$892,438
|
$1,000,898
|
|
Ancaster
|
30
|
19
|
$937,037
|
$1,107,792
|
|
Waterdown
|
11
|
17
|
$962,391
|
$1,158,382
|
|
Stoney Creek
|
56
|
61 |
$736,170
|
$758,732
|
|
Glanbrook
|
16
|
29 |
$799,619
|
$935,155
|
|
Burlington
|
119
|
114 |
$1,109,479
|
$1,048,634
|
|
Dunnville
|
7
|
6 |
$368,714
|
$574,500
|
|
Cayuga
|
3
|
2 |
$776,667
|
$762,500
|
|
Caledonia
|
9
|
9 |
$705,878
|
$800,222
|
|
Hagersville
|
3 | 10 | $580,000 |
$626,150
|
|
Grimsby
|
24
|
26 |
$830,125
|
$701,554
|
|
West Lincoln
|
9
|
12 |
$630,000
|
$851,250
|
Note: Numbers of sales represent sales reports on properties listed on the Multiple Listing Service (MLS®) of the REALTORS® Association of Hamilton-Burlington. The average price is calculated by dividing the total dollar volume of sales (not shown) by the number of sales in that month.
Year-To-Date Market Context
With the first two months of 2026 now complete, year-to-date figures provide a clearer early picture of how the market is performing compared to the same period last year.
Hamilton-Burlington Area Highlights
Home sales increased compared to January
New listings remain elevated compared to last year
Inventory levels remain higher than in 2025
Months of supply reached 3.4 months by the end of February
Local Market Observations
February often represents a transition period leading into the spring real estate market. Weather conditions, listing activity, and buyer confidence can all influence the pace of transactions during this time of year.
With the spring market approaching, new listing activity and buyer demand will be important indicators of how the Hamilton-Burlington housing market continues to develop through 2026.
Want a Closer Look?
Request a neighbourhood-specific market analysis
Get set up on instant listing notifications so you see new homes the moment they hit the market
Explore Hamilton Real Estate Trends
Hamilton Real Estate Price History Since 1990
Monthly Market Updates
Annual Market Reviews
For long-term Hamilton price trends since 1990, see our full market history report here.
Disclaimer: The statistics provided are based on information from the ITSO MLS® System, of which Cornerstone is a proud founding member. Multiple MLS® Systems operate within Ontario, and while none can be guaranteed to include every property listed or sold within a given area, they effectively illustrate market trends. Cornerstone cautions that these statistics can help identify long-term trends but should not indicate that specific properties have increased or decreased in value. Those requiring specific information on property values should contact a REALTOR®. REALTORS® have their fingers on the pulse of the market and have access to more comprehensive tools and analytics. They know the questions to ask, the areas to probe and what to look for to get a complete picture of the property and community you’re considering.
