
July 2025 Real Estate Statistics
Residential Real Estate Market Report July 2025
Sales – Average Price – New Listings – Inventory
The Hamilton, Ontario Real Estate Market in July 2025 showed a slight improvement in total overall sales, marking the first year-over-year increase since the end of 2024. There were 886 sales across the Hamilton, Burlington, Haldimand County, and Niagara North areas — up from 831 in June and up 5.5% from July 2024. Despite the increase in July, the Hamilton-Burlington area is still experiencing lower overall sales for the year. Year-to-date, there have been 5,408 sales, which is 16% lower than last year and 36% below the 10-year average.
Area Breakdown – Sales
Hamilton’s residential sales (including Flamborough, Dundas, Ancaster, Waterdown, Stoney Creek, and Glanbrook) reached 529, up 2.3% from July 2024 and up from 503 last month. Burlington recorded 210 sales, up 20.7% year-over-year and also up from 199 in June.
Average Residential Prices
The overall average residential price for July (covering all property types across Hamilton-Burlington-Haldimand-Niagara North) was $841,799, a 2% decrease from July 2024. The year-to-date average now sits at $855,677, down 2.9% from last year and down from $857,697 in June.
Area Breakdown – Prices
Hamilton’s average price was $767,654, a 2.9% drop from July 2024 and also lower than last month’s $821,716. Burlington’s average price came in at $1,116,820, up 2.1% year-over-year but still down from $1,171,517 in June. For a more in-depth look at year-to-date average prices throughout the Greater Hamilton Area, please see the chart and map below.
New Listings
There were 1,945 total residential new listings in July 2025 — down 1.2% compared to July 2024 and down from 2,064 last month. Hamilton contributed 1,257 listings, up 0.7% year-over-year, but slightly down from 1,274 in June. Burlington saw 389 new listings, down 0.5% from last year and down from 456 in June.
Inventory and Supply
The end-of-month active inventory sat at 3,912 residential listings across the region, up 18.3% from last year but slightly down from 3,960 in June. This equals 4.42 months of supply, which is up 12.2% year-over-year but down from 4.77 months in June. Hamilton had 2,506 active listings, up 25.4% from July 2024, resulting in 4.74 months of supply (down from 4.97 last month). Burlington had 732 active listings, up 20.8% year-over-year, with 3.49 months of supply (compared to 3.83 in June).
Days on Market
In Hamilton, homes took an average of 37.9 days to sell, up from 33.8 days last month and also up from July 2024. In Burlington, the average was 35.7 days, also higher than both last year and 28.5 days in June.
Market Status
The overall Greater Hamilton-Burlington Area is now in a Balanced Market, where the ratio of homes sold to homes listed is between 40% and 60%. As of July, the ratio sits at 46% — meaning approximately 4.6 homes are sold for every 10 properties listed.
Buyers MarketBelow 40% |
Balanced MarketBetween 40% and 60% |
Sellers MarketAbove 60% |
|---|---|---|
|
(Ratio of Homes Sold to Homes Listed)
|
||
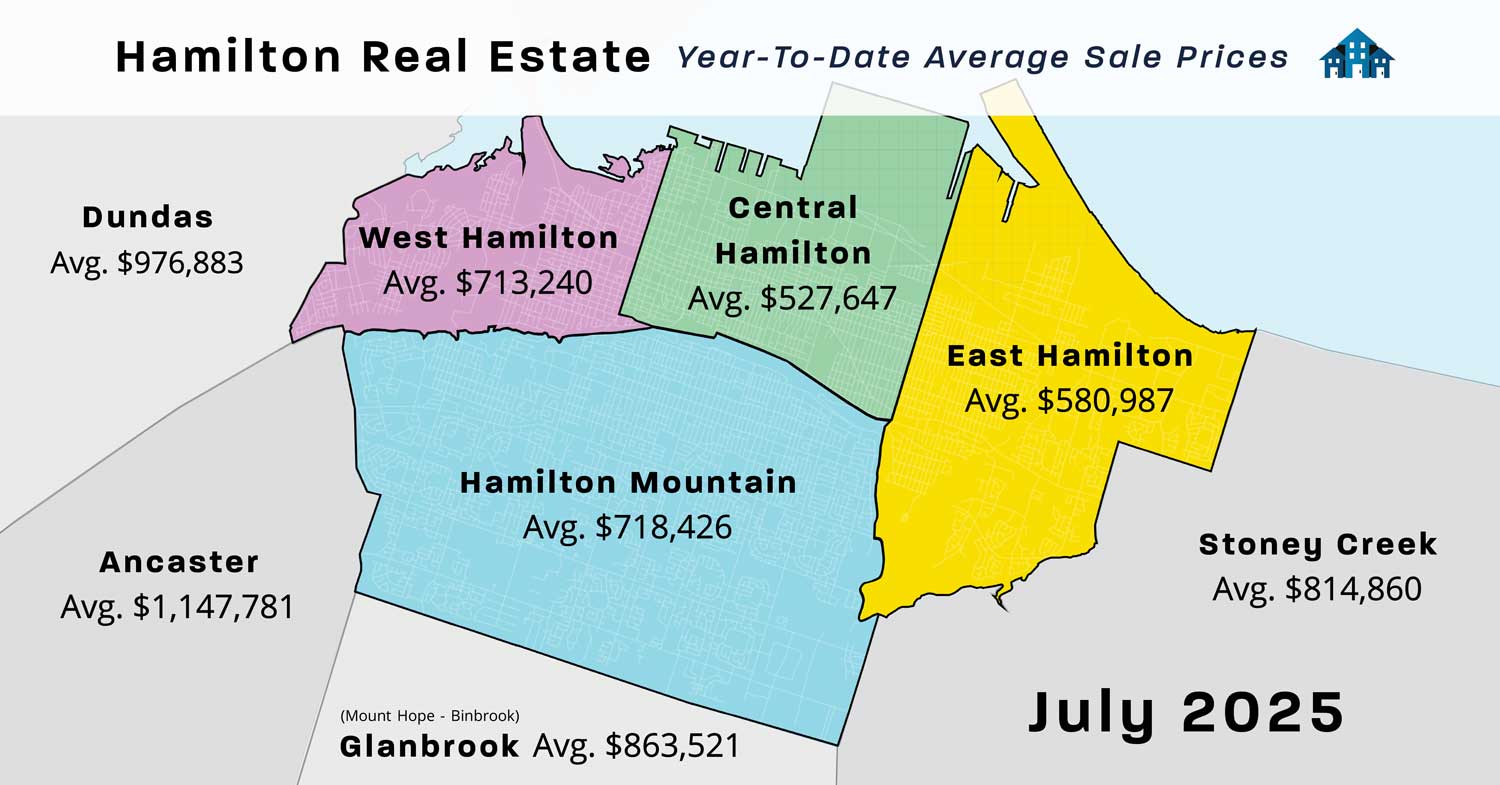
Year-to-date Average Prices For Hamilton
The map below shows the current Year-To-Date Average Residential Prices. When looking at the Average Prices in and around Hamilton, it is important to note how they have changed significantly over the last year and even now from month to month. If you are thinking of selling your house or condominium, get the most up-to-date. Here are a few other areas that are not listed on the map below.
Burlington – $1,141,045 – Down
Flamborough – $1,264,201 – Down
Waterdown – $965,705 – Down
Grimsby – $747,987 – Down
Caledonia – $747,987 – Down
Cayuga – $821,813 – Down
Dunnville – $615,005 – Down
Note that the “Average Sale Price” is based on the total dollar volume of all properties sold through the RAHB MLS® System. Average sale price can be useful in establishing long-term trends, but should not be used as an indicator that specific properties have increased or decreased in value.” What that means is, that not every house or condo has increased in price by the same percentage. It is really important to talk to an experienced local REALTOR® to see EXACTLY what is happening in your particular neighbourhood. It is also important to find out what you can do to your house to get the highest amount possible when you are ready to sell!
In this Market, it is important that you know about the houses getting listed immediately! Click Here to get set up on the Instant Listings Notification Search, otherwise, you will only know about listings once they are reported to the public sites. If you wait till you see it on Realtor.ca or other sites, it’s too late, and is probably already SOLD!
MLS® Property July 2025
RAHB Market Activity |
Number of Sales July 2025 |
Number of Sales July 2024 |
Average Sale Prices in July 2025 |
Average Sale Price July 2024 |
|
West Hamilton
|
51
|
33
|
$681,673
|
$624,615
|
|
East Hamilton
|
62
|
63
|
$583,787
|
$612,760
|
|
Central Hamilton
|
63
|
63
|
$502,893
|
$509,839
|
|
Hamilton Mountain
|
149
|
111
|
$715,475
|
$726,014
|
|
Flamborough
|
17
|
23
|
$1,226,529
|
$1,221,522
|
|
Dundas
|
24
|
24
|
$907,991
|
$904,648
|
|
Ancaster
|
47
|
42
|
$1,210,537
|
$1,208,610
|
|
Waterdown
|
26
|
25
|
$907,550
|
$872,428
|
|
Stoney Creek
|
63
|
73
|
$790,009
|
$819,773
|
|
Glanbrook
|
27
|
34
|
$886,519
|
$934,294
|
|
Burlington
|
210
|
169
|
$1,116,820
|
$1,091,186
|
|
Dunnville
|
19
|
18
|
$597,537
|
$625,701
|
|
Cayuga
|
8
|
3
|
$685,384
|
$1,113,333
|
|
Caledonia
|
13
|
20
|
$694,992
|
$894,595
|
|
Hagersville
|
8
|
5
|
$613,500
|
$860,000
|
|
Seneca
|
3
|
0
|
$1,230,000
|
$000,000
|
|
Rainham
|
2
|
3
|
$550,000
|
$650,167
|
|
Grimsby
|
43
|
40
|
$827,521
|
$832,890
|
|
West Lincoln
|
9
|
13
|
$784,200
|
$954,417
|
Note: Numbers of sales represent sales reports on properties listed on the Multiple Listing Service (MLS®) of the REALTORS® Association of Hamilton-Burlington. The average price is calculated by dividing the total dollar volume of sales (not shown) by the number of sales in that month.
