
January-June 2025 Hamilton ON Real Estate Statistics
January to June 2025 – Drop In Sales Marks Slowest Start To The Year Since 2010
The Hamilton-Burlington real estate market has seen some major shifts when comparing the first half of 2025 to the same period in 2020 — especially for detached homes. Sales of detached properties dropped from 3,826 in early 2020 to 2,934 in 2025, while new listings rose from 5,443 to 7,082. This means more detached homes are available, but fewer are selling, giving buyers more choice and more negotiating power. The average time on market for a detached home also crept up, from 28 days in 2020 to 33.8 days this year.
Despite slower activity, detached home prices have risen significantly over the five-year span. The average sale price went from $719,677 in 2020 to $962,344 in 2025 — a jump of nearly 34%. It’s worth noting, though, that prices actually peaked at $1,243,660 in early 2022, before interest rate hikes and economic uncertainty cooled the market. With months of inventory for detached homes more than doubling from 1.78 to 3.87, conditions today are much more balanced — and in some areas, tipping toward a buyer’s market. Sellers need to price competitively and prepare for longer selling times, while buyers can take advantage of increased supply and reduced pressure.
Looking at the broader market across all property types, the Year-to-Date average residential sale price in the Greater Hamilton Area — which includes Burlington, Dundas, Ancaster, Glanbrook, Haldimand, and Grimsby — sits at $857,697. That’s a 3.1% decline compared to the same time last year. Breaking it down by city, Hamilton’s average price is $786,679, while Burlington remains significantly higher at $1,148,522. So far this year, there have been 4,484 sales, down 19.7% year-over-year, indicating a general slowdown in buyer activity despite pockets of strength in some Hamilton neighbourhoods.
On the supply side, new listings have seen a modest increase, with 11,222 properties listed across the region — up 3.9% from last year. Hamilton contributed 7,108 of those listings, up 7.2%, while Burlington saw 2,333 new listings, a 1.5% increase. Homes are also taking longer to sell: the average time on market is now 36.2 days, a 21% jump from last year. That includes 36.5 days in Hamilton and a slightly quicker 29.3 days in Burlington. Overall, the data paints a picture of a market with more inventory, slower sales, and softer prices, especially when compared to the more competitive conditions of recent years.
**See below for Average Price charts and maps for districts and neighbourhoods throughout the Greater Hamilton Area!**
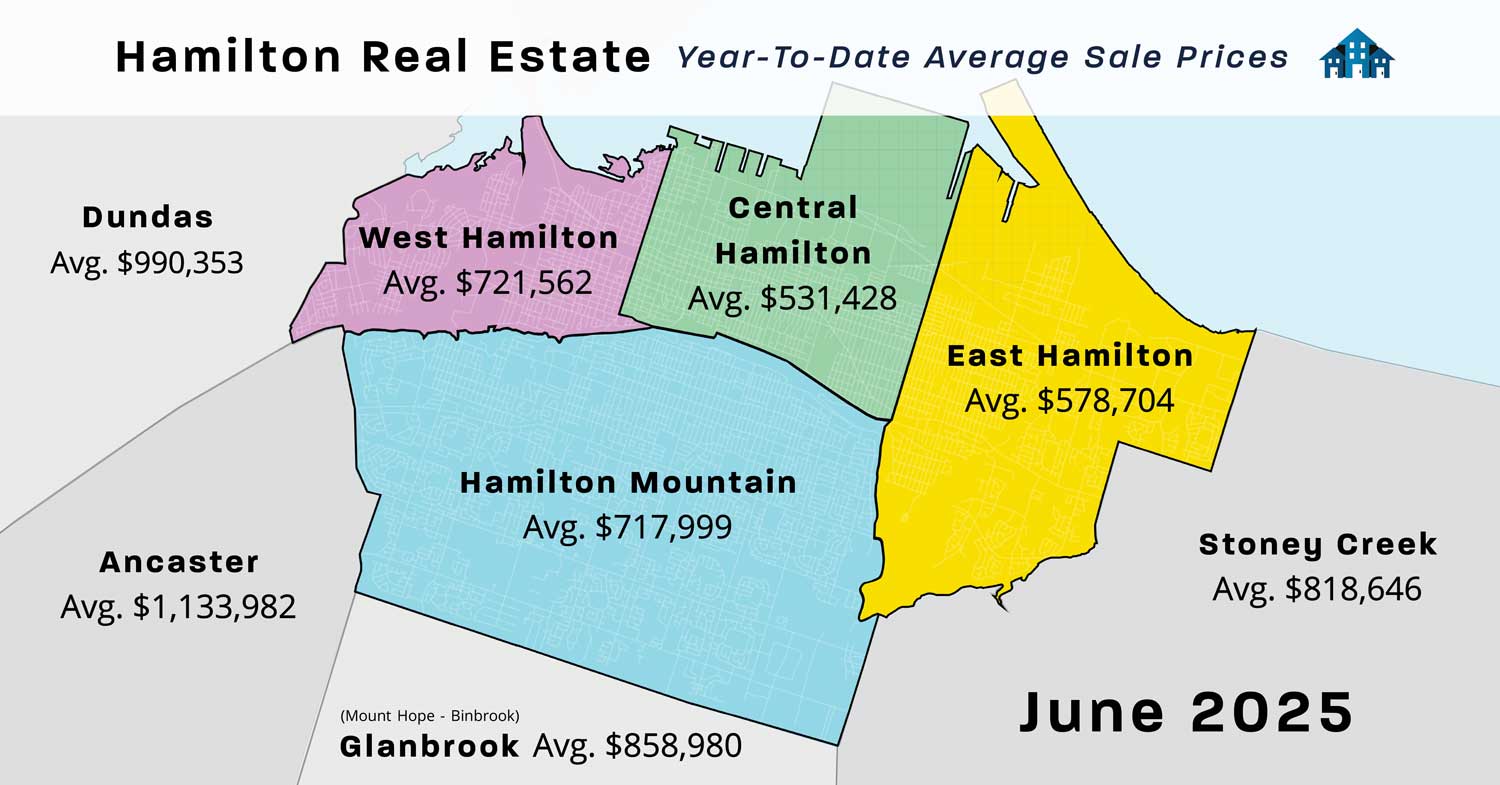
Hamilton’s Average Year-to-date Prices
The map shows the current Year-To-Date Average Residential Prices and those areas not shown on the map are in the chart. When looking at the Average Prices in and around Hamilton, it is important to note how they have changed significantly over the last few years and from month to month. Looking to buy or sell real estate in Hamilton, Ontario? Stay updated with the latest trends and market conditions to make informed decisions. Whether you’re searching for a new home or investment property, understanding the current Hamilton real estate market dynamics is crucial.
Burlington – $1,148,552 – Up
Flamborough – $1,270,442 – Up
Waterdown – $974,949 – Down
Grimsby – $850,879 – Down
Caledonia – $756,819 – Up
Cayuga – $871,750 – Down
Dunnville – $619,003 – Up
Note that the “Average Sale Price” is based on the total dollar volume of all properties sold through the RAHB MLS® System. Average sale price can be useful in establishing long-term trends, but should not be used as an indicator that specific properties have increased or decreased in value.” What that means is, that not every house or condo has increased in price by the same percentage. It is really important to talk to an experienced local REALTOR® to see EXACTLY what is happening in your particular neighbourhood. It is also important to find out what you can do to your house to get the highest amount possible when you are ready to sell!
In this Market, it is important that you know about the houses getting listed immediately! Click Here to get set up on the Instant Listings Notification Search, otherwise, you will only know about listings once they are reported to the public sites. If you wait till you see it on Realtor.ca or other sites, it’s too late, and is probably already SOLD!
10-Year Comparison For Districts & Neighbourhoods
(10 Years Ago vs. Now in 2025)
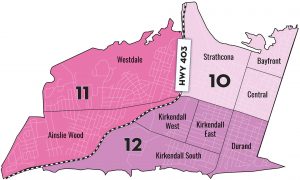
West Hamilton
Districts 10, 11, 12
————————————-
10 years ago in 2015, the average price was $363,955.
So far this year it is $721,562 and up 2.5% from last year.
| District |
Neighbourhoods |
Homes Listed | Homes Sold | Average Price |
| 10 | North West Bayfront. Strathcona, Central South |
188 |
52 |
$587,799 |
| 11 | Westdale, Ainslie Wood |
170 |
74 |
$699,531 |
| 12 | Durand, Kirkendall |
262 |
78 |
$831,638 |
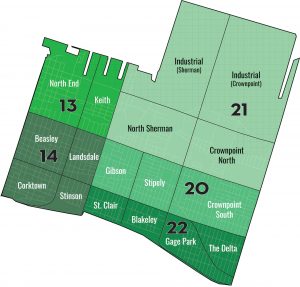
Central Hamilton
Districts 13, 14, 15, 20, 21, 22
————————————-
10 years ago in 2015, the average price was $224,485.
So far this year it is $531,428 and down 4.8% from last year.
|
District |
Neighbourhoods |
Homes Listed |
Homes Sold |
Average Price |
| 13 | North End, Keith |
94 |
33 |
$525,159 |
| 14 | Beasley, Landsdale, Corktown, Stinson |
319 |
91 |
$466,819 |
| 20 | Gibson, Stipley, Crownpoint |
336 |
124 |
$513,591 |
| 21 | North Sherman, Crownpoint North |
69 |
29 |
$426,493 |
| 22 | St. Clair, Blakeley, Gage Park, Delta |
146 |
70 |
$690,578 |
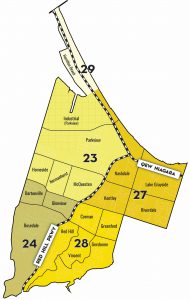
East Hamilton
Districts 23, 24, 27, 28, 29
————————————-
10 years ago in 2015, the average price was $274,062.
So far this year it is $578,704 and down 5.5% from last year.
|
District |
Neighbourhoods |
Homes Listed |
Homes Sold |
Average Price |
| 23 | Parkview, Homeside, Normanhurst, McQuesten, Industrial |
269 |
136 | $509,794 |
| 24 | Bartonville, Glenville, Rosedale |
119 |
68 |
$634,107 |
|
27 |
Nashdale, Lakely, Grayside, Kentley, Riverdale |
71 |
34 |
$629,100 |
| 28 | Red Hill, Corman, Greenford, Gershome, Vincent | 217 | 93 | $599,744 |
| 29 | Hamilton Beach |
47 |
8 |
$784,050 |
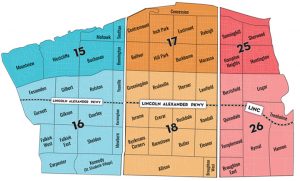
Hamilton Mountain
Districts 15, 16, 17, 18, 25, 26
————————————-
10 years ago in 2015, the average price was $395,587.
So far this year it is $717,999 and down 4.8% from last year.
|
District |
Neighbourhoods |
Homes Listed |
Homes Sold |
Average Price |
| 15 | Mountview, Westcliffe, Buchanan, Southam, Bonnington, Mohawk | 216 | 99 | $779,742 |
| 16 | Fessenden, Gilbert, Rolston, Yoeville, Gurnett, Gilkson, Gourley, Kerninghan, Falkirk, Kennedy, Yeoville, St. Elizabeth Village, Carpenter, Mewburn, Sheldon | 314 | 132 | $723,166 |
| 17 | Centremount, Inch Park, Eastmount, Raleigh, Balfour, Hill Park, Burkhome, Macassa, Concession | 391 | 178 | $637,329 |
| 18 | Greeningdon, Bruleville, Thorner, Lawfield, Jerome, Crerar, Barnstown, Rushdale, Bulter, Randall, Eleanor, Allison, Ryckmans Corners |
370 |
140 |
$796,498 |
| 25 | Sunninghill, Sherwood, Hampton Heights, Huntington |
124 |
64 |
$691,795 |
| 26 | Berrisfield, Lisgar, Trenholme, Quinndale, Templemead, Rymal, Hannon, Broughton East |
162 |
78 |
$789,331 |
Other Areas Around Hamilton
Ancaster – District 42
10 years ago in 2015, the average price was $546,025.
So far this year it is $1,133,982 and down 5.4 % from last year.
Stoney Creek – District 50, 51, 52
10 years ago in 2015, the average price was $417,899.
So far this year it is $818,646 and down 1.3% from last year.
Glanbrook – District 53
10 years ago in 2015, the average price was $413,540.
So far this year it is $858,980 and down 2.9% from last year.
Waterdown – District 46
10 years ago in 2015, the average price was $498,865.
So far this year it is $974,949 and down 2.5% from last year.
Dundas – District 41
10 years ago in 2015, the average price was $458,085.
So far this year it is $990,353 and up 7% from last year.
Burlington – District 30, 31, 33, 34, 35, 36, 38
10 years ago in 2014, the average price was $578,016.
So far this year it is $1,148,552 and up 0.7% from last year.
Grimsby – District 54,55
10 years ago in 2015, the average price was $392,512.
So far this year it is $850,879 and down 4% from last year.
Flamborough – District 40, 43, 44, 45
10 years ago in 2015, the average price was $634,596.
So far this year it is $1,270,442 and down 2.2% from last year.
June 2025 Statistics
Inventory levels continue to play a critical role in shaping home values across the Hamilton-Burlington area. In June 2025, there were 2,064 new residential listings posted through the local real estate board — down 16% from May, and virtually flat compared to June 2024 (down just 0.1%). Of those, Hamilton accounted for 1,274 listings, slightly up from 1,264 a year earlier, while Burlington saw 456 new listings, down from 471 last June.
Sales activity has softened. There were 831 residential sales across the region in June, a 6.4% decrease year-over-year and a 13% drop from May. Despite the slowdown in transactions, prices moved upward month-over-month. The average sale price rose from $852,483 in May to $889,801 in June, although that’s still 2.1% lower than June 2024. In Hamilton, 503 homes sold, down 5.8% year-over-year, with an average price of $821,716, down just 0.8% from last year but up from May’s average of $777,786. Burlington reported 199 sales, a 4.3% dip from last June, with an average price of $1,171,517 — down 3.3% year-over-year but up from $1,134,994 last month.
The increase in active listings is gradually shifting the market. At the end of June, there were 3,960 active residential listings across the region, up from 3,246 at the same time last year and from 3,231 at the end of May. This brings the region to 4.77 months of supply, a notable increase from 3.69 months in June 2024 and 4.12 months in May. In Hamilton, the current supply is 4.97 months, up 35.4% year-over-year, while Burlington sits at 3.83 months, up 32.7%. Homes are also taking longer to sell: average days on market rose from 29 to 33.8 in Hamilton, and from 23 to 28.5 in Burlington, compared to June 2024.
The Hamilton-Burlington Area is sitting at the low end of a Balanced Market Status, where the ratio of Homes Sold to Homes Listed falls between 40% and 60%, currently sitting at 40% (4 homes sold for every 10 listed). We use a formula of Total Sales divided by Total Listings to determine whether we are experiencing a Buyers Market, a Balanced Market, or a Sellers Market. (See definitions in the chart below). Important Note: If you are currently looking for a property, ask your REALTOR® to show you the history of any property you are interested in. This will give you valuable information about how long the property has been for sale, when/if the price was adjusted and possibly how much it sold for previously!
Buyers MarketBelow 40% |
Balanced MarketBetween 40% and 60% |
Sellers MarketAbove 60% |
|---|---|---|
|
(Ratio of Homes Sold to Homes Listed)
|
||
MLS® Property Listings June 2025
RAHB Market Activity |
Number of Sales June 2025 |
Number of Sales June 2024 |
Average Sale Prices in June 2025 |
Average Sale Price June 2024 |
|
West Hamilton
|
39
|
41
|
$759,216
|
$662,078
|
|
East Hamilton
|
48
|
46 |
$596,490
|
$614,647
|
|
Central Hamilton
|
63
|
42 |
$501,270
|
$536,566
|
|
Hamilton Mountain
|
121
|
136 |
$731,836
|
$774,235
|
|
Flamborough
|
25
|
20 |
$1,405,232
|
$1,366,097
|
|
Dundas
|
22
|
30 |
$1,218,450
|
$902,617
|
|
Ancaster
|
41
|
39
|
$1,158,121
|
$1,299,920
|
|
Waterdown
|
27
|
25
|
$848,056
|
$968,200
|
|
Stoney Creek
|
82
|
86 |
$894,418
|
$817,345
|
|
Glanbrook
|
35
|
30 |
$836,874
|
$953,154
|
|
Burlington
|
199
|
199 |
$1,171,517
|
$1,215,419
|
|
Dunnville
|
18
|
11 |
$632,322
|
$550,500
|
|
Cayuga
|
3
|
10 |
$871,667
|
$717,790
|
|
Caledonia
|
12
|
16 |
$742,583
|
$814,375
|
|
Hagersville
|
3 | 2 | $584,633 |
$627,500
|
|
Seneca
|
3
|
2 |
$870,000
|
$1,075,000
|
|
Rainham
|
5
|
4 |
$371,600
|
$740,000
|
|
Grimsby
|
31
|
35 |
$787,287
|
$930,814
|
|
West Lincoln
|
10
|
7 |
$961,449
|
$666,714
|
Note: Numbers of sales represent sales reports on properties listed on the Multiple Listing Service (MLS®) of the REALTORS® Association of Hamilton-Burlington. The average price is calculated by dividing the total dollar volume of sales (not shown) by the number of sales in that month.
