
2024 Jan-Dec Solds Hamilton ON Statistics Price Report
2024 Year in Review Statistics & Property Values Report
Economic uncertainty and higher interest rates weighed on the housing market this year. The Bank of Canada Rate remained at 5% since the last increase in July 2023 until June of 2024 when it started to come down. This led to a sluggish Spring Real Estate Market, with lower sales and increased listings. The Bank of Canada Rate dropped five times since then and now sits at 3.25% with the next announcement coming at the end of January 2025. It is important to note that the Bank of Canada Rate only affects Variable Mortgages. Fixed Mortgage Rates in Canada are influenced by something called bond yields, which are basically the returns investors get from lending money to the government. For example, the 5-year fixed mortgage rate is closely tied to the 5-year bond yield. When bond yields go up or down, fixed mortgage rates often follow the same direction. The average five-year term fixed rate is just over 5% (with a low of just under 4%) for an insured Mortgage. Uninsured rates are higher. Please note that mortgage rates can vary based on individual circumstances and lender policies. For the most accurate and personalized information, it’s advisable to consult directly with trusted professional mortgage lenders or financial advisors.
The increased inventory continued to affect home prices, which made purchasers felt more confident in the Real Estate Market, and Sales began to increase in the second half of the year. With overall lower sales for the year and increased inventory, the Hamilton and surrounding area is currently sitting in a Balanced Market with a List-To-Sell Ratio of 48%.
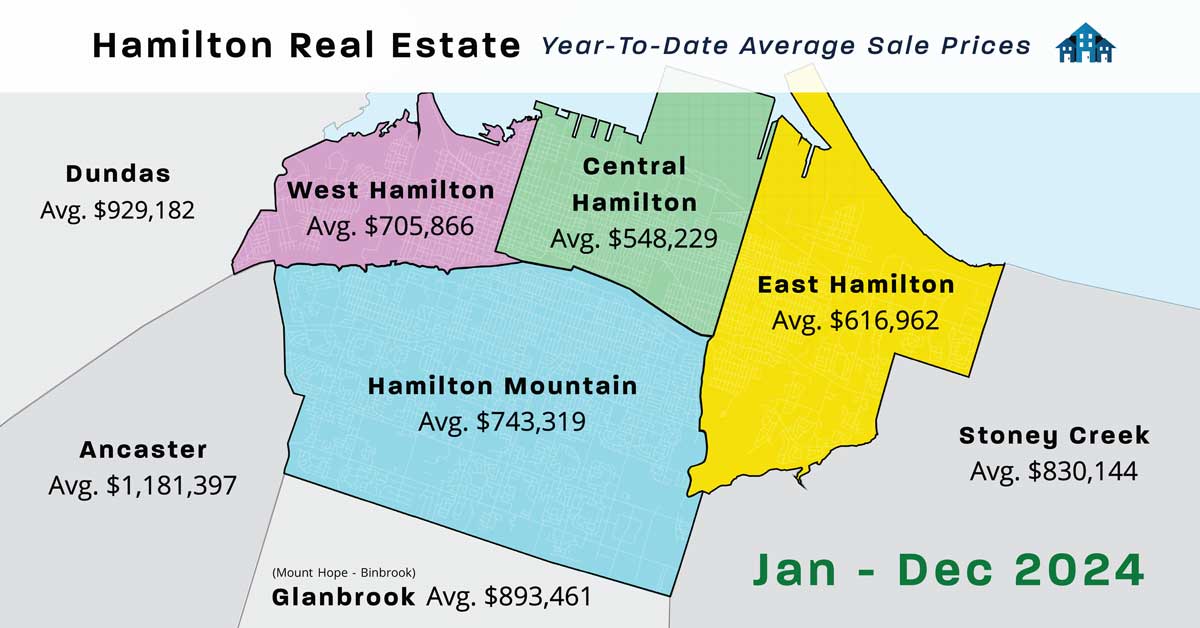
Overall Average Sales Prices increased slightly by 2% year over year throughout the area. The REALTORS ® Association of Hamilton-Burlington (RAHB) Areas can be broken into 4 distinct sub-divisions to give an overall view of the average prices. Hamilton now sits at $807,905 (up 1%), Burlington is at $1,124,750 (up 3%), Haldimand is at $717,259 (2%) and Niagara North is at $831,750 (up 1%). The entire RAHB area has an average price of $876,359 for 2024 compared to $862,457 in 2023 and $955,429 for 2022. Sales dropped by only 1% year over year with New Listings increasing by 10%. With more options to choose from, buyers feel less pressure and homes are sitting on the market longer. In Hamilton, we went from 25 days to 32 days year over year. In Burlington, it went from 22 to 27, in Haldimand from 38 to 44, and in Niagara North from 32 to 39 days. The year-to-date average prices for specific types of properties are $995,566 for detached, $751,085 for Semi-detached, $737,785 for Row (townhomes), and $570,431 for Apartments. There are still a few neighbourhoods in Hamilton where the average price is under $600,000 for a detached home, all in the North and East parts of the city. The Hamilton Mountain neighbourhoods range from $672,439 to $899,664 average price for a detached home.
See below for Average Selling Prices of Districts and Neighbourhoods in and around Hamilton Ontario, comparing average sales from 2024 to 5 (2019) and 10 (2014) years ago. Below these charts is the Month of December 2024 Statistics Report.

VS
Average Selling Prices Compared to 2019 and 2014
Here is an overview of the 2024 Average Selling Prices for Residential Properties in and around Hamilton Ontario Canada, compared to 5 years ago (2019) and 10 years ago (2014). Each area includes neighbourhoods and Real Estate Districts in and around Hamilton Ontario.

West Hamilton
Neighbourhood Features – McMaster University, Westdale Village (Weils Bakery, Westdale Theatre), Locke Street Shops, Hess Street, West Harbour Go Station, Bayfront Park, Royal Botanical Gardens, Dundurn Castle, Farmers Market, and quick access to Highway 403.
2024 West Hamilton Overview
- $705,866 – Average Selling Price
- 500 – Total # of Sales
- 1074 – Total # of New Listings
- 37.5 – Average Days on the Market
Compared to Previous Years…
- $706,376 in 2023 (1 year ago)
- $503,943 in 2019 (5 years ago)
- $338,840 in 2014 (10 years ago)
| District | Nighbourhoods |
Average Prices in 2014
|
Average Prices in 2019
|
Average Prices in 2024
|
|---|---|---|---|---|
|
10
|
Bayfront, Strathcona, Central
|
$269,103
|
$442,144
|
$611,892
|
|
11
|
Westdale, Ainslie Wood
|
$367,358
|
$522,629
|
$718,247
|
|
12
|
Durand, Kirkendall
|
$362,774
|
$529,955
|
$750,725
|
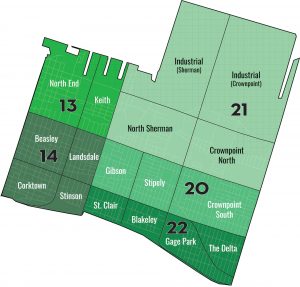
Central Hamilton
Neighbourhood Features – Known as Downtown Hamilton, and home to Gore Park, Gage Park, Ottawa Street Shops, Go Bus Station,Tim Hortons Field (Tiger-Cats Football & Forge FC Soccer), Art Crawl and Supercrawl.
2024 Central Hamilton Overview
- $548,229 – Average Selling Price
- 735 – Total # of Sales
- 1,738 – Total # of New Listings
- 30.6 – Days on the Market
Compared to Previous Years…
- $560,738 in 2023 (1 year ago)
- $390,923 in 2019 (5 years ago)
- $201,984 in 2014 (10 years ago)
| District | Neighbourhoods | Average Prices in 2014 | Average Prices in 2019 | Average Prices in 2024 |
|---|---|---|---|---|
| 13 |
North End |
$185,344 | $381,357 | $538,598 |
| 14 |
Beasley, Landsdale |
$201,895 | $360,818 | $500,904 |
| 20 |
Corktown, Stinson, Crown Point, Gibson, Stipley |
$189,572 | $382,101 | $530,550 |
| 21 |
Central Mall Area |
$134,182 | $315,166 | $455,328 |
| 22 |
St. Clair, Blakeley, Deta |
$270,806 | $492,009 | $709,510 |
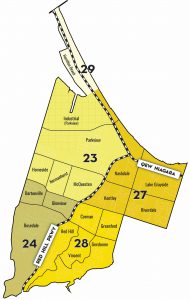
East Hamilton
Neighbourhood Features – Home to the famous Hutches and Barangas on the Beach Restaurants at Confederation Park on the lake, Waterfront Trail (all the way to Burlington), Eastgate Mall, Brock University Campus, Kings Forest Golf Course and very easy access to QEW Niagara and Toronto, Red Hill Valley Parkway and the Skyway Bridge.
2024 East Hamilton Overview
- $616,962 – Average Selling Price
- 681 – Total # of Sales
- 1,267 – Total # of New Listings
- 31.7 – Days on the Market
Compared to Previous Years…
- $635,292 in 2023 (1 year ago)
- $411,935 in 2019 (5 years ago)
- $224,411 in 2014 (10 years ago)
|
District
|
Neighbourhoods
|
Average Prices in 2014
|
Average Prices in 2019
|
Average Prices in 2024
|
|---|---|---|---|---|
|
23
|
Homeside, Normanhurst, McQuesten, Parkview
|
$185,485
|
$365,877
|
$533,593
|
|
24
|
Rosedale, Bartonville, Glenview
|
$250,512
|
$438,272
|
$650,978
|
|
27
|
Riverdale, Kenley
|
$253,523
|
$444,357
|
$648,724
|
|
28
|
Greenford, Vincent, Gershome
|
$233,712
|
$419,990
|
$661,475
|
|
29
|
Hamilton Beach
|
$338,856
|
$588,686
|
$809,933
|
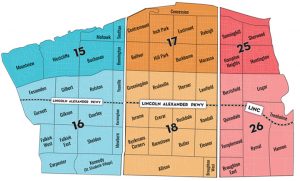
Hamilton Mountain
Neighbourhood Features – Limeridge Mall Shopping Centre, Mohawk College, Hillfield Strathallan Private College, Westmount School and Recreation Centre, Huntington Park Rec Centre, Bernie Arbour Moahawk Sports Park, Chedoke Twin Pad Arena, LINC (Lincoln Alexander Expressway) Escarpment Rail Trail and Chedoke Radial Trail, Numerous Waterfalls.
2024 Hamilton Mountain Overview
- $743,319 – Average Selling Price
- 1,517 – Total # of Sales
- 2,747 – Total # of New Listings
- 28.5 – Average Days on the Market
Compared to Previous Years…
- $752,071 in 2023 (1 year ago)
- $501,432 in 2019 (5 years ago)
- $302,402 in 2014 (10 years ago)
| District | Neighbourhoods | Average Prices in 2014 | Average Prices in 2019 | Average Prices in 2024 |
|---|---|---|---|---|
| 15 |
Mountview, Westcliffe, Buchanan, Southam, Bonnington, Mohawk |
$335,441 | $335,441 | $803,788 |
| 16 |
Fessenden, Gilbert, Rolston, Yeoville, Gurnett, Gilkson, Gourley, Kernighan, Falkirk East, Falkirk West, Kennedy, Carpenter |
$321,131 | $515,536 | $777,239 |
| 17 |
Centremount, Inch Park, Eastmount, Raleigh, Balfour, Hill Park, Burkhome, Macassa |
$253,185 | $435,753 | $664,834 |
| 18 |
Greeningdon, Bruleville, Thorner, Lawfield, Jerome, Crerar, Barnstown, Rushdale, Butler, Randall, Eleanor, Allison, Ryckmans Corners |
$332,614 | $544,170 | $808,070 |
| 25 |
Sunninghill, Sherwood, Hampton Heights, Huntington |
$283,407 | $493,190 | $723,068 |
| 26 |
Berrisfield, Lisgar, Trenholme, Quinndale, Templemead, Broughton |
$281,536 | $485,653 | $699,567 |

Stoney Creek
Neighbourhood Features – Battlefield Park, Eramosa Karst Conservation Area and Caves, Devils Punchbolw Waterfalls and Conservation Area, Felkers Falls, Valley Park Community Centre, Winona, 50 Point Conservation Area and Marina.
2024 Stoney Creek Overview
- $830,144 – Average Selling Price
- 918 – Total # of Sales
- 2,044 – Total # of New Listings
- 35 – Average Days on the Market
Compared to Previous Years…
- $819,923 in 2023 (1 year ago)
- $562,782 in 2019 (5 years ago)
- $355,478 in 2014 (10 years ago)
| District | Neighbourhoods | Average Prices in 2014 | Average Prices in 2019 | Average Prices in 2024 |
|---|---|---|---|---|
| 50 | Heritage Green, Valley Park, Felker, Trinity, Highland, Leckie Park | $348,504 | $565,266 | $848,764 |
| 51 | Battlefield, Corman, South Meadow, Highway Valley, Dewitt, Eastdale, Polar Park, Guernsey, Westmeria, Fruitland, Community Beach, Winona Park | $355,621 | $559,143 | $808,974 |
| 52 | Rural Stoney Creek | $471,074 | $615,062 | $1,097,665 |

Dundas
Neighbourhood Features – Home of the fun filled Buskerfest and Cactus Festivals, Dundas Driving Park, Dundas Valley Golf and Curling Club, Dundas Valley Conservation Area, Downtown Dundas Shops and Restaurants in a small town setting.
2024 Dundas Overview
- $929,182 – Average Selling Price
- 289 – Total # of Sales
- 445 – Total # of New Listings
- 31.3 – Average Days on the Market
Compared to Previous Years…
- $931,738 in 2023 (1 year ago)
- $615,770 in 2019 (5 years ago)
- $402,530 in 2014 (10 years ago)
| District | Neighbourhoods | Average Prices in 2014 | Average Prices in 2019 | Average Prices in 2024 |
|---|---|---|---|---|
|
41 |
Pleasant View, Hopkins Corner, Cootes Paradise, University Gardens, Dundana, Grosvenor’s Estate, Highland Park, Pleasant Valley |
$402,530 |
$615,770 |
$929,182 |

Ancaster
Neighbourhood Features – Home of best brunch at Ancaster Old Mill Restaurant, Tiffany and Sherman Waterfalls, Hamilton Golf and Country Club, Gables Golf Club, Meadowlands Power Centre (Costco), Redeemer University College, Ancaster Fairgrounds, Spring Valley Arena.
2024 Ancaster Overview
- $1,181,397 – Average Selling Price
- 513 – Total # of Sales
- 1,171 – Total # of New Listings
- 37.3 – Average Days on the Market
Compared to Previous Years…
- $1,145,515 in 2023 (1 year ago)
- $773,288 in 2019 (5 years ago)
- $494,318 in 2014 (10 years ago)
| District | Neighbourhoods | Average Prices in 2014 | Average Prices in 2019 | Average Prices in 2024 |
|---|---|---|---|---|
|
42 |
Sulphur Spring, Ancaster Heights, Oakhill, Meadowlands, Parkview Heights, Nakoma, Harmony Hall, Shaver, Southcote |
$495,318 |
$773,288 |
$1,181,397 |

Glanbrook
Neighbourhood Features – John C. Munro International Airport, Canadian Warplane Heritage Museum, Garth Trails & Twenty Place Adult Senior Living Condominiums, Southern Pines Golf and Country Club, Glanbrook Sports Complex, Binbrook Fairground Community Park.
2024 Glanbrook Overview
- $893,461 – Average Selling Price
- 413 – Total # of Sales
- 831 – Total # of New Listings
- 34.4 – Average Days on the Market
Compared to Previous Years…
- $884,571 in 2023 (1 year ago)
- $588,206 in 2019 (5 years ago)
- $369,460 in 2014 (10 years ago)
| District | Neighbourhoods | Average Prices in 2014 | Average Prices in 2019 | Average Prices in 2024 |
|---|---|---|---|---|
|
53 |
Glanbrook, Binbrook, Mount Hope |
$369,460 |
$588,206 |
$893,461 |
Grimsby
Neighbourhood Features – Niagara Peninsula Town, On The QEW Between Niagara and Toronto, Nelles Manor (1798 Loyalist Residence), Lake Views, Lake Access Point At Nelles Park Beach & Grimsby Beach Park, Lookout Trail, Conservation, Happening On The Forty Festival, Centennial Park, Forty Creek Distillery, Beamer Falls.
2024 Grimsby Overview
- $867,701 – Average Selling Price
- 456 – Total # of Sales
- 950 – Total # of New Listings
- 38.1 – Average Days on the Market
Compared to Previous Years…
- $862,156 in 2023 (1 year ago)
- $586,014 in 2019 (5 years ago)
- $371,701 in 2014 (10 years ago)
| District | Neighbourhoods | Average Prices in 2014 | Average Prices in 2019 | Average Prices in 2024 |
|---|---|---|---|---|
|
54 |
Grimsby South & North |
$371,701 |
$586,014 |
$867,701 |
Waterdown
Neighbourhood Features – Clappison’s Corners, Royal Botanical Gardens, Waterdown Memorial Park, Smokey Hollow Waterfalls, Joe Sam’s Leisure Park, Waterdown Supercentre Shopping.
2024 Waterdown Overview
- $986,113 – Average Selling Price
- 369 – Total # of Sales
- 757 – Total # of New Listings
- 30.8 – Average Days on the Market
Compared to Previous Years…
- $997,887 in 2023 (1 year ago)
- $702,472 in 2019 (5 years ago)
- $464,244 in 2014 (10 years ago)
| District | Neighbourhoods | Average Prices in 2014 | Average Prices in 2019 | Average Prices in 2024 |
|---|---|---|---|---|
|
46 |
Waterdown East & West |
$464,244 |
$702,472 |
$986,113 |
Burlington
Neighbourhood Features – Millcroft Shopping Centre, Millcroft Golf Club, Tansley Woods Community Centre, Spencer Smith Park, Burlington Beach, Burlington Golf and Country Club, Tyandaga Golf Course, Ikea, LaSalle Park, LaSalle Marina, Royal Botanical Gardens.
2024 Burlington Overview
- $1,124,155 – Average Selling Price
- 2336 – Total # of Sales
- 4227 – Total # of New Listings
- 27.9 – Average Days on the Market
Compared to Previous Years…
- $1,096,137 in 2023 (1 year ago)
- $755,017 in 2019 (5 years ago)
- $525,271 in 2014 (10 years ago)
| District | Neighbourhoods | Average Prices in 2014 | Average Prices in 2019 | Average Prices in 2024 |
|---|---|---|---|---|
|
30 |
Aldershot |
$538,803 |
$813,579 |
$1,147,206 |
|
31 |
Plains, Maple, Central |
$483,075 |
$740,988 |
$1,054,419 |
|
32 |
Dynes, Longmoor, Pinedale |
$431,901 |
$679,416 |
$994,695 |
|
33 |
Roseland, Shoreacres, Elizabeth Gardens |
$660,292 |
$1,048,428 |
$1,509,691 |
|
34 |
Tyandaga, Mountainside, Brant Hills |
$474,383 |
$695,006 |
$1,055,032 |
|
35 |
Headon Forest, Palmer, Tansley, Millcroft, Orchard, Corporate |
$467,224 |
$680,857 |
$1,044,376 |
|
36 |
Alton West, Alton East |
$537,320 |
$802,403 |
$1,110,562 |
|
38 |
North Burlington Rural |
$891,343 |
$1,169,515 |
$2,277,691 |
Monthly Report For December 2024
December 2024 had only 351 Total Residential Listings come through the Hamilton Real Estate Board which was down 74% from New Listings in November (1,354), and also down 26% from December 2023 (477) as reported by The REALTORS ® Association of Hamilton-Burlington (RAHB). Hamilton had 232 (down from 310 in 2023) and Burlington had 64 (down from 74 in December 2023).
Residential Sales located throughout the RAHB market area (including Burlington and all outlying areas covered by RAHB) of 278 Properties were down from 810 in November, and down from December 2023 by 40%. Residential Sales in Hamilton (which includes Hamilton plus Flamborough, Dundas, Ancaster, Waterdown, Stoney Creek and Glanbrook) were 175 of that total and the Average Hamilton Residential Sales Price of those were $785,695 in December 2024 up 4% from December 2023, $754,467. Burlington had 59 Sales (down from 102 in 2023) with an Average Price of $997,253 (down 5% from the $1,049,755 Average Price in December 2023). The Overall Average Price for Residential Properties including all areas was $831,280 down 1% from November 2024, $843,529 however a slight 2% increase from December 2023.
The end-of-month listing inventory shows 1,956 Active Residential Listings, giving Hamilton 11.18 months of inventory, which is up 53% compared to 1,276 Properties still available for sale at the end of December last year which was 4.1 months of inventory. Burlington has 8.17 months of inventory (up 53%) with 482 active listings for sale. Average Days on the market increased from 39 last year to 45 days this December for Hamilton, however, decreased in Burlington from 40 one year ago, to 36 days this December.
The Hamilton – Burlington Area experienced a Sellers Market in December, where the ratio of Homes Sold to Homes Listed (556 Sales/567 New Listings) is above 60%, currently sitting at 100% for Residential, (in other words, 10 homes sold for every 10 new listings).
|
Buyers Market Below 40% |
Balanced Market Between 40% and 60% |
Sellers Market Above 60% |
|
(Ratio of Homes Sold to Homes Listed)
|
||
MLS® Property Listings December 2024
| RAHB Market Activity | Number of Sales Dec 2024 |
Number of Sales Dec 2023 |
Average Sale Price in Dec 2024 | Average Sale Price Dec 2023 |
| West Hamilton | 22 | 25 | $728,839 | $716,540 |
| East Hamilton | 33 | 34 | $600,033 | $632,845 |
| Central Hamilton | 43 | 38 | $539,918 | $495,645 |
| Hamilton Mountain | 89 | 70 | $712,540 | $707,996 |
| Flamborough | 12 | 12 | $1,192,519 | $1,443,160 |
| Dundas | 24 | 12 | $930,995 | $1,121,667 |
| Ancaster | 23 | 19 | $1,171,304 | $935,289 |
| Waterdown | 21 | 17 | $904,881 | $857,347 |
| Stoney Creek | 58 | 53 | $788,740 | $767,974 |
| Glanbrook | 19 | 16 | $789,415 | $838,806 |
| Burlington | 126 | 98 | $1,040,535 | $1,049,699 |
| Dunnville | 14 | 4 | $574,857 | $584,250 |
| Cayuga | 3 | 0 | $646,833 | $000,000 |
| Caledonia | 10 | 4 | $752,150 | $667,000 |
| Hagersville | 2 | 1 | $586,250 | $645,000 |
| Seneca | 4 | 1 | $1,225,500 | $685,000 |
| Rainham | 2 | 0 | $490,000 | $000,000 |
| Grimsby | 17 | 10 | $851,118 | $716,350 |
| West Lincoln | 12 | 2 | $802,092 | $922,500 |
